SIMON FRASER UNIVERSITY Department of Economics Econ 305 Prof. Kasa
advertisement
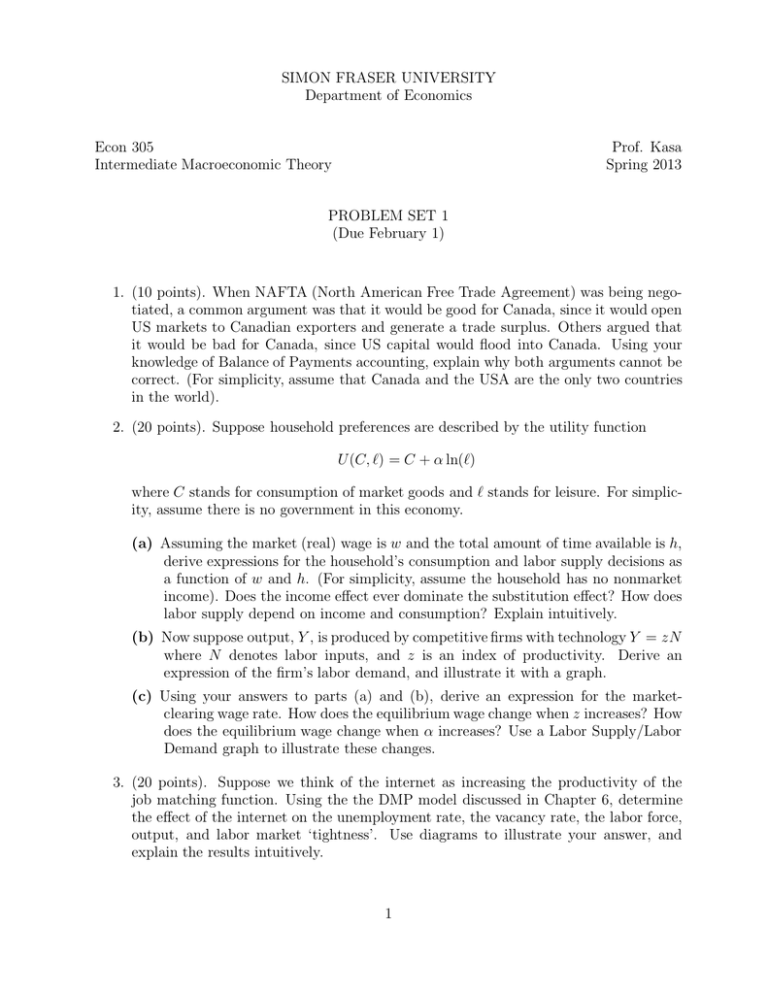
SIMON FRASER UNIVERSITY Department of Economics Econ 305 Intermediate Macroeconomic Theory Prof. Kasa Spring 2013 PROBLEM SET 1 (Due February 1) 1. (10 points). When NAFTA (North American Free Trade Agreement) was being negotiated, a common argument was that it would be good for Canada, since it would open US markets to Canadian exporters and generate a trade surplus. Others argued that it would be bad for Canada, since US capital would flood into Canada. Using your knowledge of Balance of Payments accounting, explain why both arguments cannot be correct. (For simplicity, assume that Canada and the USA are the only two countries in the world). 2. (20 points). Suppose household preferences are described by the utility function U (C, `) = C + α ln(`) where C stands for consumption of market goods and ` stands for leisure. For simplicity, assume there is no government in this economy. (a) Assuming the market (real) wage is w and the total amount of time available is h, derive expressions for the household’s consumption and labor supply decisions as a function of w and h. (For simplicity, assume the household has no nonmarket income). Does the income effect ever dominate the substitution effect? How does labor supply depend on income and consumption? Explain intuitively. (b) Now suppose output, Y , is produced by competitive firms with technology Y = zN where N denotes labor inputs, and z is an index of productivity. Derive an expression of the firm’s labor demand, and illustrate it with a graph. (c) Using your answers to parts (a) and (b), derive an expression for the marketclearing wage rate. How does the equilibrium wage change when z increases? How does the equilibrium wage change when α increases? Use a Labor Supply/Labor Demand graph to illustrate these changes. 3. (20 points). Suppose we think of the internet as increasing the productivity of the job matching function. Using the the DMP model discussed in Chapter 6, determine the effect of the internet on the unemployment rate, the vacancy rate, the labor force, output, and labor market ‘tightness’. Use diagrams to illustrate your answer, and explain the results intuitively. 1
