Finding change points in fMRI time series data
advertisement
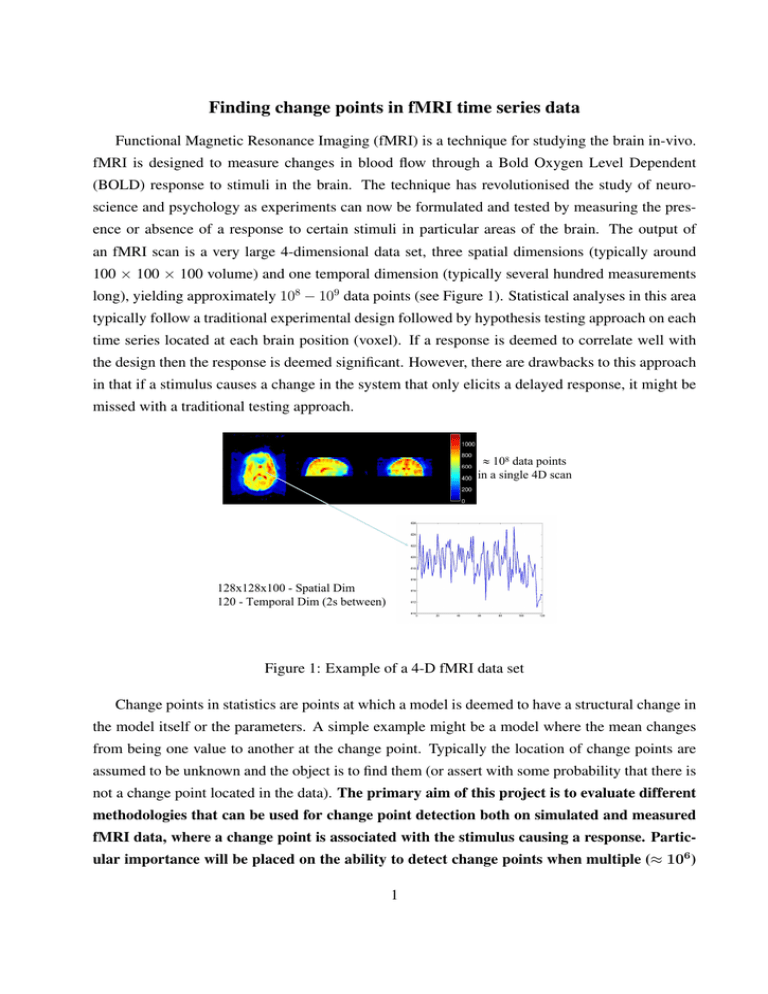
Finding change points in fMRI time series data Functional Magnetic Resonance Imaging (fMRI) is a technique for studying the brain in-vivo. fMRI is designed to measure changes in blood flow through a Bold Oxygen Level Dependent (BOLD) response to stimuli in the brain. The technique has revolutionised the study of neuroscience and psychology as experiments can now be formulated and tested by measuring the presence or absence of a response to certain stimuli in particular areas of the brain. The output of an fMRI scan is a very large 4-dimensional data set, three spatial dimensions (typically around 100 × 100 × 100 volume) and one temporal dimension (typically several hundred measurements long), yielding approximately 108 − 109 data points (see Figure 1). Statistical analyses in this area typically follow a traditional experimental design followed by hypothesis testing approach on each time series located at each brain position (voxel). If a response is deemed to correlate well with the design then the response is deemed significant. However, there are drawbacks to this approach in that if a stimulus causes a change in the system that only elicits a delayed response, it might be missed with a traditional testing approach. ≈ 108 data points in a single 4D scan 128x128x100 - Spatial Dim 120 - Temporal Dim (2s between) Figure 1: Example of a 4-D fMRI data set Change points in statistics are points at which a model is deemed to have a structural change in the model itself or the parameters. A simple example might be a model where the mean changes from being one value to another at the change point. Typically the location of change points are assumed to be unknown and the object is to find them (or assert with some probability that there is not a change point located in the data). The primary aim of this project is to evaluate different methodologies that can be used for change point detection both on simulated and measured fMRI data, where a change point is associated with the stimulus causing a response. Particular importance will be placed on the ability to detect change points when multiple (≈ 106 ) 1 time series are evaluated simultaneously. Two particular methods for detecting change points are M. A. Lindquist et al. (2007) and J. A. D. Aston et al. (2008), which both attempt to quantify the uncertainty in the change point detection. The project will evaluate these and other methods on fMRI data. Abilities Required: Some knowledge of probability will be useful as most change point methods are probabilistically based. In addition, the project will require large scale computation, so some knowledge of MATLAB would be very useful. No prior knowledge of neuroimaging or neuroscience is required. PhD Opportunities: This project very naturally leads into a PhD project where not only is the temporal data used to detect change points, but the spatial information incorporated as well. As change point at a particular location at a particular time is more likely if the spatial locations nearby also are deemed to have a change point at that time, and thus the spatial information should dramatically increase the sensitivity of detection. References J. A. D. Aston, J. Y. Peng and D. E. K. Martin (2008) Implied Distributions in Multiple Change Point Problems. CRiSM Research Reports, University of Warwick, 2008-26. M. A. Lindquist, C. Waugh and T. D. Wager (2007). Modeling state-related fMRI activity using changepoint theory. NeuroImage, 35:1125-1141. 2
