From: AAAI Technical Report SS-94-05. Compilation copyright © 1994, AAAI (www.aaai.org). All rights reserved.
Reconstructing
3-D Blood Vessel Shapes
from Multiple
X-Ray Images
Henry A. Rowley and Takeo Kanade
har~cs.cmu.edu, tk@cs.cmu.edu
Computer Science Department
Carnegie Mellon University
Introduction
Angiography is a method used by radiologists to examine the structure and health of blood vessels. The
methodconsists of injecting an x-ray opaque contrast
agent into the bloodstream, and taking one or more
x-ray images of the vessel. Although these images
are clear and have high resolution, they individually
show structures in only two-dimensions. The goal of
our work is to automatically reconstruct the threedimensional structure of a blood vessel using a small
number of angiogram images taken from different angles.
Amongthe types of information about blood vessels
that are useful to physicians, the most important for
diagnostic purposes is a measure of the cross-sectional
area of the vessel at every location along its length.
This information reveals constrictions caused by blood
clots, cholesterol build-ups, or injuries. Treatment of
these conditions mayinvolve inserting a catheter, with
a small video camera and scraping tool mounted at its
tip, into the vessel to removethe obstruction. A computer can aid in planning this surgery by simulating
what the tip of the catheter would encounter in the
vessel, and by computing how far the catheter must
be inserted to begin repair.
This paper presents an algorithm which performs
the three-dimensional reconstruction task. Each section of the paper will examine one of the main steps of
the algorithm: detecting vessels in single images, finding the positions of the vessels in three dimensions,
and finally performing diameter measurements. The
paper concludes with some reconstruction results.
Finding Vessels in Single Images
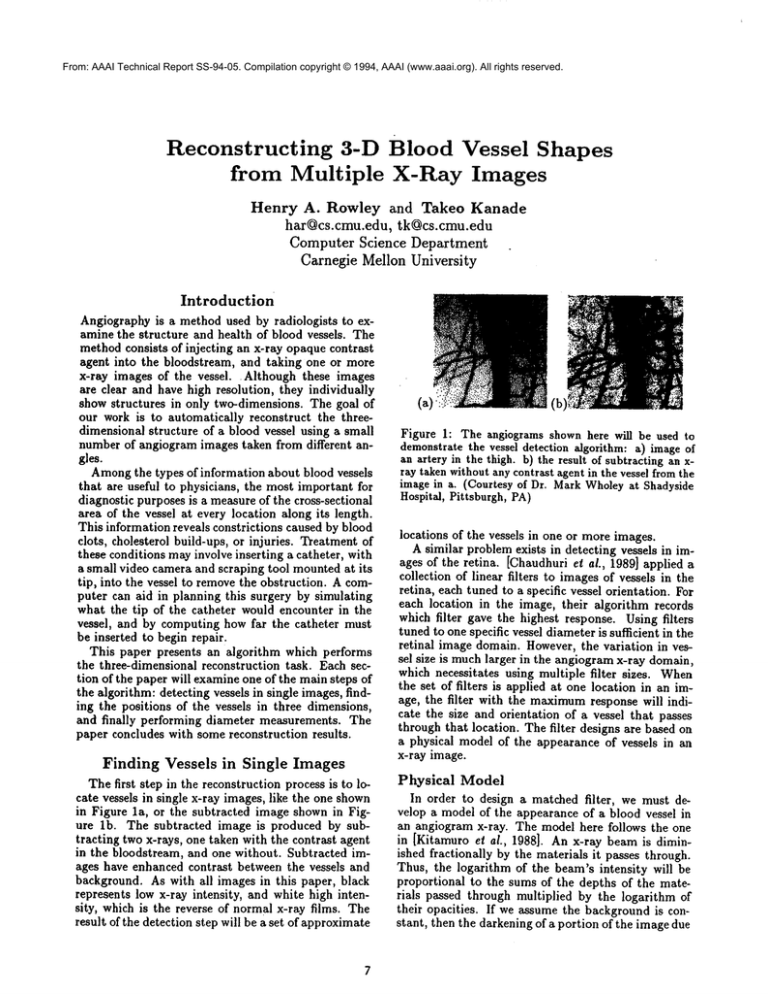
The first step in the reconstruction process is to locate vessels in single x-ray images, like the one shown
in Figure la, or the subtracted image shown in Figure lb. The subtracted image is produced by subtracting two x-rays, one taken with the contrast agent
in the bloodstream, and one without. Subtracted images have enhanced contrast between the vessels and
background. As with all images in this paper, black
represents low x-ray intensity, and white high intensity, which is the reverse of normal x-ray films. The
result of the detection step will be a set of approximate
(b)
Figure h The angiograms shown here will be used to
demonstrate the vessel detection algorithm: a) image of
an artery in the thigh, b) the result of subtracting an xray taken without any contrast agent in the vessel from the
image in a. (Courtesy of Dr. Mark Wholeyat Shadyside
Hospital, Pittsburgh, PA)
locations of the vessels in one or more images.
A similar problem exists in detecting vessels in images of the retina. [Chaudhuri el al., 1989] applied a
collection of linear filters to images of vessels in the
retina, each tuned to a specific vessel orientation. For
each location in the image, their algorithm records
which filter gave the highest response. Using filters
tuned to one specific vessel diameter is sufficient in the
retinal image domain. However, the variation in vessel size is muchlarger in the angiogramx-ray domain,
which necessitates using multiple filter sizes. When
the set of filters is applied at one location in an image, the filter with the maximumresponse will indicate the size and orientation of a vessel that passes
through that location. The filter designs are based on
a physical model of the appearance of vessels in an
x-ray image.
Physical
Model
In order to design a matched filter,
we must develop a model of the appearance of a blood vessel in
an angiogram x-ray. The model here follows the one
in [Kitamuro el ai., 1988]. An x-ray beam is diminished fractionally by the materials it passes through.
Thus, the logarithm of the beam’s intensity will be
proportional to the sums of the depths of the materials passed through multiplied by the logarithm of
their opacities. If we assume the background is constant, then the darkening of a portion of the image due
Width 5:
Width 10:
Width 15:
rJltet
mdtt, ~
A
~nu0
i
Figure 2: The box showsa synthetic image of vessels with
radii of (fromleft to right) 15, 10, and 5 pixels. Thegraph
showsthe intensity along a horizontal line in the image.
o
.’0
4~
ī
./J ~i",,
.
Figure 4: The images show the responses of the three
filters applied to the synthetic imagein Figure 2, and the
graph plots the responses along a horizontal line across the
image.
~tn
:.
,’0
, ,.
,
J
t4U
:~l,
Figure 3: Cross-sections of matchedfilters tuned to vessels with radii of (fromleft to right) 15, 10, and 5 pixels.
to a bloodvessel will be proportionalto the vessel’s
depth perpendicular to the image plane. If we further assumethat the vessel’s center line is locally in a
plane parallel to the image plane, and has a circular
cross-section, then intensity profile across the vessel
will have the following form:
B + 2~/r 2 - ~2. logO
Figure 5: Responseof different orientations of the radius
5 filter, whenplaced over the radius 5 vessel.
or zero mean noise, such normalized filters will give
a response of zero. One difficulty is that since the
filters for thicker vessels are larger, their responses
will have a higher magnitude compared with filters
for narrower vessels. This problem was not addressed
in [Chaudhuri et aL, 1989J, as in retinal images, the
vessels were all detectable using one filter size. In
angiogram images, the difference in size between the
largest and smallest vessels is often as high as a factor of twenty, so multiple size filters are needed. To
resolve this problem, the filter images are further normalized so that for a constant opacity, each filter will
give the same magnitude response when applied to a
vessel of the size and orientation to which it is tuned.
Cross-sections of filters tuned to vessels in Figure 2
are shown in Figure 3. Figure 4 shows the response of
three vertically oriented filters tuned to radii of 5, 10,
and 15 pixels are movedacross the image in Figure 2.
Figure 5 shows the angular sensitivity of the filters,
by plotting the response for filters of different orientations when applied over a vessel. In each case, the
where B is the background intensity, O is the opacity of the vessel (a numberbetween 0 and 1), r is the
vessel’s radius, and x is the distance between point
where the intensity is being computed and the vessel’s center line. Figure 2 illustrates this model with
a synthetic image of three vessels of different radii,
each with the same opacity value, and a background
intensity of zero.
Filter
Design
As discussed in [Chaudhuri el al., 1989], the optimal filter for detecting an even, real valued signal is
the signal itself. Thus matchedfilters are produced by
synthesizing images of a short segment of a vessel of a
particular size and orientation¯ The filter images are
normalized to have an average value of zero. Whenapplied to images with a constant or linear background,
8
I
(a)l ......’ l(b)
Figure 6: Vessel detection results: a) the angle and size
of the filter that respondedbest at each pixel in the angiogram of Figure lb, represented by the orientation and
length of line segments, b) the result of applying the
heuristic edge linking process to the results shownin a.
The line thickness is proportional to the averageof the
sizes of the filters that responded
alongthe edge.
filters give their highest response whenapplied to the
vessel size and orientation to which they are tuned.
Post-Processing
As can be seen in the filter response in Figure 4, as a
filter is movedacross a correspondingsize vessel in the
direction perpendicular to the vessel’s orientation, the
response will reach a local maximumwhen the filter
is over the center of the vessel. Therefore, after a
filter is applied to an x-ray image, a ridge detector can
more precisely locate the vessels. The ridge detector
suppresses all filter responses where the magnitude of
the response is not a local maximumin the direction
perpendicular to the vessel.
With the filter designs in hand, we can process each
x-ray image as follows:
¯ Computethe logarithm of the intensity of each pixel
¯ For each filter tuned to a specific size and orientation:
- Apply the filter to the image
- Applya ridge detector to the filter results
¯ Record the size and orientation of the filter that
gave the highest magnitude response for each pixel
One characteristic of the matchedfilters visible in
Figure 4 is that small filters can respond at the edges
of a larger vessel, with one side of the filter matching the edge. To solve this problem, we examine each
pixel (in order from the largest to the smallest magnitude filter response), assume that it represents the
center of a vessel, and suppress any filter responses
that might be due to the vessel’s edges. Finally, we
use the thresholding method of [Otsu, 1979] to suppress weak filter responses. The results of all these
steps applied to the image in Figure lb are shown in
Figure 6a. The figure shows the direction and size of
the filter that gives the best response at each pixel
location.
Edge Linking
The output from the above filtering process is a collection of pixels which maybe part of the center line of
a vessel. The next step is to perform edge tracking, to
link pixels together into curves which may represent
vessels. The edge tracking is performed using a local
graph search technique guided by a heuristic function,
as described in [Gonazahz and Woods, 1992]. The algorithm maintains a collection of possible edges, and
selected edges with higher heuristic ratings for extending with more pixels. The most highly weighted component of the evaluation function measures the maximum"error" along the edge so far. This error indicates, for each position along the edge, the difference
between the size and orientation of a pixel compared
with the average Of the sizes and orientations of the
previous few pixels along the edge. In case of ties in
the error measure, comparisons are made based on the
number of consecutive pixels along the curve at which
no filter responded. This allows the edges to jump
over small gapsl but penalizes large jumps. Finally,
in case of ties in that measure, the total number of
jumps over no response pixels is used. The result of
running the edge linking algorithm on the above filtering result gives Figure 6b. Manyslight changes can be
made to these heuristics, resulting in different edges
being linked together. However,the precise details are
not significant, as only approximatelocalization of the
vessels is needed for the next step of the algorithm.
Locating
Vessels
in Three Dimensions
Starting with the two-dimensional location results of
the previous section, we can use multiple images to
localize blood vessels in three dimensions. To find the
three-dimensional path of the center line of the vessel, we use the snakes algorithm [Kass et al., 1987].
Snakes are defined as a connected sequence of positions in space, each of which can moveabout in three
dimensions. Each node experiences forces in the plane
of an image which pull towards dark areas, to align
curve with a vessel, and internal forces which keep
the curve from developing sharp corners. By combining forces from several images taken at different
angles, the snake is moved into alignment with the
three-dimensional position of the vessel’s center line.
The results from the vessel detection in single images are not yet integrated with this part of the program. At present we initialize
the snake by manually
selecting its start and end points, and linearly interpolating between them.
Measuring
Vessel
Diameters
The final step is to measure the diameters of the
vessels. Just as a curve was used to model the center
line of the vessel, a flexible cylindrical surface is used
to represent the vessel’s actual shape [Terzopoulos et
al., 1987]. The complete model used to represent a
vessel’s shape is shown in Figure 7. To measure the
diameter of a vessel, the program examines the intensity profile across the vessel, and matches this with
an expected intensity profile similar to the one used
to design the matched filters [Kitamuro et al., 1988].
This model has six parameters which are varied with
this with the three-dimensional localization process.
An important consideration in this work is that for
the reconstructions to be useful, they must be accurate. While it may not be possible to compare the
model with direct physical measurements, it is possible to use other imaging modalities such as Computed
Tomography (CT) and ultrasound to cross-check the
results.
Weare arranging with Shadyside Hospital
(where the x-rays were obtained) to perform such comparisons.
Figure 7: Modelused to represent a blood vessel.
Acknowledgements
Figure 8: Anangiogramimage, showing arteries in the
knee. (Courtesy of Dr. MarkWholeyat Shadyside Hospital, Pittsburgh, PA)
a non-linear fitting algorithm to find the best fit. The
diameter parameter estimate is used to apply forces to
the flexible surface model, deforming it into alignment
with the vessel’s shape.
Results
and Conclusions
The system has been tested with three sequences
of angiogram images, provided by Shadyside Hospital
in Pittsburgh, PA, which show arteries in the pelvis,
thigh, and knee. Figure 8 shows one frame from
the latter sequence, and Figure 9 presents the threedimensional reconstruction of the main vessel and one
of its branches. Note that a constriction in the main
vessel, below the branch, has been successfully reconstructed.
The current program requires a some manual input
to set the initial position estimates of the blood vessel
center lines. Workis in progress to automate the task
of detecting vessels in single images, and to integrate
Figure 9: Reconstructionof the vessels shownin Figure 8.
10
Wegreatfully acknowledge the contributions of Dr.
Mark Wholey and Katherine Hill at Shadyside Hospital, who provided the x-ray image data and other
information. Thanks are also due to Shumeet Baluja
for his careful reading of drafts of this paper.
This work was supported in part by the Avionics
Laboratory, Wright Research and Development Center, Aeronautical Systems Division (AFSC), U.S. Air
Force, Wright-Patterson Air Force Base, OH454336543, under Contract F33615-C1465, ARPAOrder
No. 7597. The views and conclusions contained in
this document are those of the authors and should
not be interpreted as representing the official policies,
either expressed or implied, of ARPAor the U.S. government.
References
[Chaudhuri et al., 1989]
Subhasis Chaudhuri, Shankar Chatterjee, Norman
Katz, Mark Nelson, and Michael Goldbaum. Detection of blood vessels in retinal images using twodimensional matched filters.
IEEE Transactions on
Medical Imaging, 8(3):263-269, September 1989.
[Gonazalezand Woods, 1992] Rafael C. Gonazalez
and Richard E. Woods. Digital Image Processing. Addison-Wesley Publishing Company, Reading, Massachusetts, 1992.
[Kass et al., 1987] Michael Kass, Andrew Witkin,
and Demetri Terzopoulos. Snakes: Active contour
models. In Proceedings of the First International
Conference on Computer Vision, pages 259-268,
1987.
[Kitamuro et al., 1988] Koichi
Kitamuro,
Jonathan M. Tobis, and Jack Sklansky. Estimating
the 3-D skeletons and transverse areas of coronary
arteries from biplane angiograms. IEEE Transactions on Medical Imaging, 7(3):173-176, 1988.
[Otsu, 1979] Nobuyuki Otsu. A threshold selection
method from gray-level histograms. IEEE Transactions on Systems, Man, and Cybernetics, SMC9:62-66, January 1979.
[Terzopoulos et al., 1987] Demetri Terzopoulos, Andrew Witkin, and Michael Kass. Symmetry-seeking
models for 3-D object recognition. In Proceedings
of the First International Conference on Computer
Vision, page 269, 1987.


