Analysis of Online Question-Answering Forums as Heterogeneous Networks
Tsuyoshi Murata
Tomoyuki Ikeya
Department of Computer Science, Graduate School of Information Science and Engineering, Tokyo Institute of Technology
W8-59 2-12-1 Ookayama, Meguro, Tokyo 152-8552 Japan
murata@cs.titech.ac.jp
ikeya@ai.cs.titech.ac.jp
Abstract
Analyzing social interactions of CGM (Consumer Generated Media) is important for encouraging commnication among users. In the case of question-answering forums, users and QA boards constitute a heterogeneous
network whose nodes are users/boards and edges are
authorship. Discovering both user communities and
board communities and finding correlations between
them will clarify their characteristics. This paper describes an attempt for analyzing heterogeneous social
networks obtained from Yahoo! Chiebukuro (Japanese
Yahoo! Answers). A new measurement for the correlation between user communities and board communities
is defined, and characteristics of discovered communities are analyzed using it.
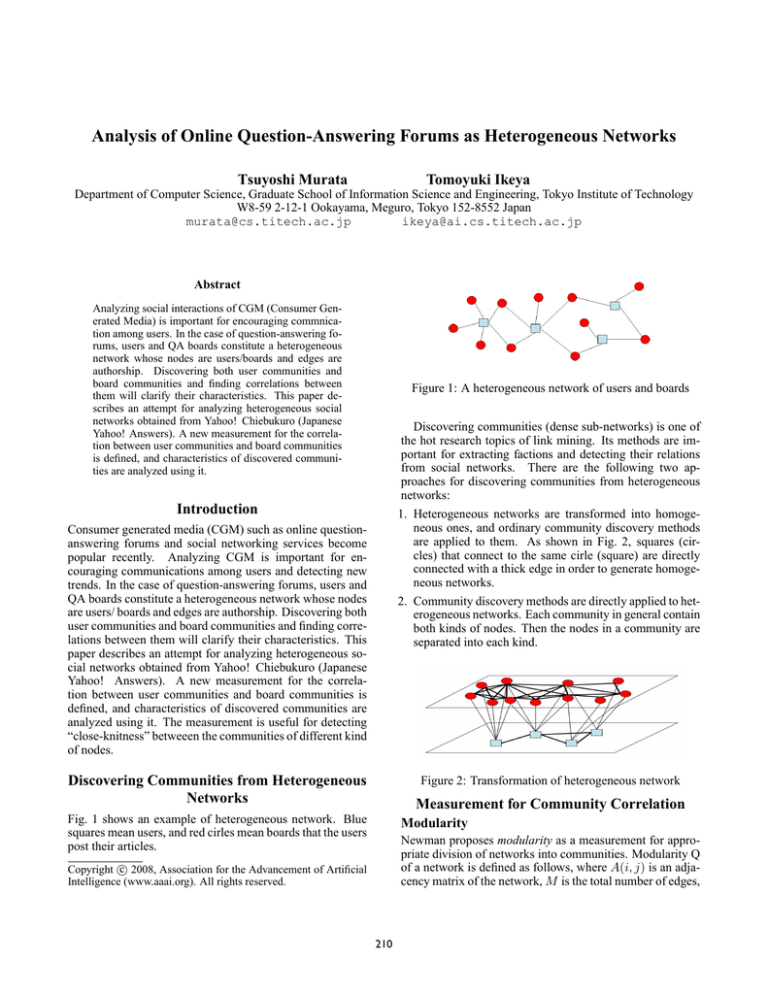
Figure 1: A heterogeneous network of users and boards
Discovering communities (dense sub-networks) is one of
the hot research topics of link mining. Its methods are important for extracting factions and detecting their relations
from social networks. There are the following two approaches for discovering communities from heterogeneous
networks:
1. Heterogeneous networks are transformed into homogeneous ones, and ordinary community discovery methods
are applied to them. As shown in Fig. 2, squares (circles) that connect to the same cirle (square) are directly
connected with a thick edge in order to generate homogeneous networks.
2. Community discovery methods are directly applied to heterogeneous networks. Each community in general contain
both kinds of nodes. Then the nodes in a community are
separated into each kind.
Introduction
Consumer generated media (CGM) such as online questionanswering forums and social networking services become
popular recently. Analyzing CGM is important for encouraging communications among users and detecting new
trends. In the case of question-answering forums, users and
QA boards constitute a heterogeneous network whose nodes
are users/ boards and edges are authorship. Discovering both
user communities and board communities and finding correlations between them will clarify their characteristics. This
paper describes an attempt for analyzing heterogeneous social networks obtained from Yahoo! Chiebukuro (Japanese
Yahoo! Answers). A new measurement for the correlation between user communities and board communities is
defined, and characteristics of discovered communities are
analyzed using it. The measurement is useful for detecting
“close-knitness” betweeen the communities of different kind
of nodes.
Discovering Communities from Heterogeneous
Networks
Figure 2: Transformation of heterogeneous network
Measurement for Community Correlation
Fig. 1 shows an example of heterogeneous network. Blue
squares mean users, and red cirles mean boards that the users
post their articles.
Modularity
Newman proposes modularity as a measurement for appropriate division of networks into communities. Modularity Q
of a network is defined as follows, where A(i, j) is an adjacency matrix of the network, M is the total number of edges,
c 2008, Association for the Advancement of Artificial
Copyright ⃝
Intelligence (www.aaai.org). All rights reserved.
210
V is a set of vertices, and Vl and∑
Vm are communities discovered from the network: Q = l∈1..L (ell − a2l ) (elm =
∑
∑
∑
1
1
i∈Vl
i∈Vl ,j∈V A(i, j)).
j∈Vm A(i, j), al = 2M
2M
Table 1: Discovered User Communities (Approach 1)
nodes
20177
17841
11254
1533
114
92
85
55
51
44
Community Variance
Modularity is a measurement for division of homogeneous
networks. In the case of heterogeneous networks, correspondence between communities of different kind of nodes will
clarify “close-knitness” of nodes. For example, in the case
of Fig. 3, nodes in the leftmost community of lower-layer
are connected to the nodes in one upper-layer community.
This means that the users (squares) of the community post
to closely related boards (circles), so the users’ interests are
focused to limited topics. On the other hand, in the case of
Fig. 4, nodes in the leftmost community of lower-layer are
connected to the nodes in many upper-layer communities,
which means that the users have interests to diverse topics.
com/var
0.0240
0.1950
0.0893
0.0570
0.0391
0.0854
0.0418
0.1136
0.1367
0.0765
category(percentages of connected nodes)
Entertainment(17),News(14),Fashion(10)
Fashion(36),Child(17),Life(11)
Yahoo! JAPAN(32),Sports(20),Internet(19)
Fashion(16),Culture(14),Travel(13)
Fashion(34),Life(11),Entertainment(10)
Life(26),Job(21),Fashion(8)
Fashion(27),Entertainment(20),Internet(12)
Entertainment(24),Fashion(14),Life(13)
Life(25),Fashion(20),Travel(10)
Sports(20),Fashion(17),Entertainment(13)
Yahoo!
Chiebukuro (Japanese Yahoo!
Answers,
http://chiebukuro.yahoo.co.jp). The site is one of the
most popular question-answering forums in Japan. From
the heterogeneous networks, communities are discovered by
the above two approaches. Clauset’s algorithm, a bottom-up
method for finding divisions of high modularities, is used
as the method for discovering communities. Community
variance is then calculated for each community. A list of
discovered user communities is shown in Table 1. Each
row corresponds to one user community. The columns are
the number of nodes in a user community, its community
variance, and the major categories of the boards that are
connected to its users.
Table 1 shows that there are three giant user communities. Community variance of the second user community is
much bigger than others. The categories of the boards that
are connected by the users of the user community are Fashion(36), Child(17), and Life(11). The reason of high community variance is that it is a “close-knit”community; most
of the users are interested in Fashion. Visualization of the
communities are shown in Fig. 5. User communities and
board communities are displayed in separate windows.
Figure 3: “Close-knit” Communities
We call such “close-knitness” as community variance and
define it as follows:
∑
∑
1 ∑
yi
ν= 2
xi , Y =
yi
(xi − X)2 , X =
X i
Y
i
i
Figure 4: Community Variance
In Fig. 4, nodes of the leftmost community (size X) in
lower-layer are connected to x1 , x2 , ... nodes that belong to
the upper-layer communities of size y1 , y2 , ..., respectively.
If the nodes of the leftmost lower-layer community are randomly connected to the nodes of upper-layer communities,
yi
yi
Y X nodes are connected, respectively. xi − Y X of the
definition means the gap between the random connections
and actual connections. If community variance of a lowerlayer community is zero, there is no correlation between the
community and upper-layer communities. If the variance is
bigger, there is strong correlation between the communities
of two layers.
Figure 5: Visualizing Heterogeneous Communities
Conclusion
Experiments
This paper describes an attempt for analyzing heterogeneous
social networks. Community variance is useful for characterizing communities of one layer by those of the other layer.
We have generated heterogeneous social networks
composed of users and boards from the data of
211


