Remote Sensing Seminar ... Lab 5 – SEVIRI and MODIS Clouds and Fires
advertisement

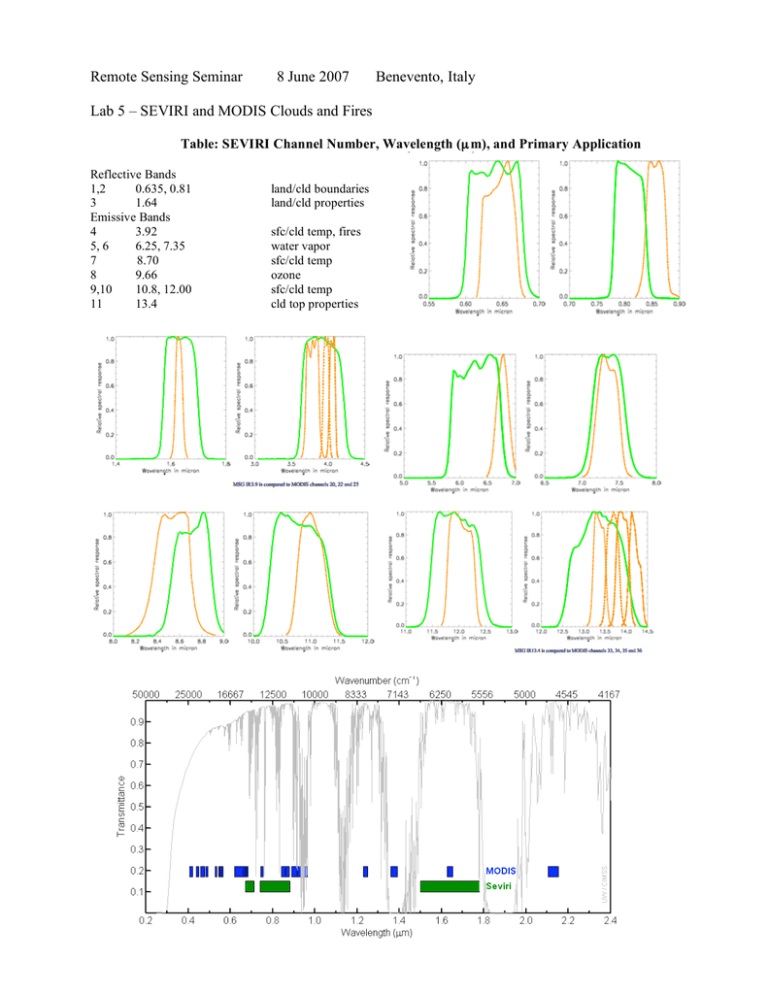
Remote Sensing Seminar 8 June 2007 Benevento, Italy Lab 5 – SEVIRI and MODIS Clouds and Fires Table: SEVIRI Channel Number, Wavelength (µ m), and Primary Application Reflective Bands 1,2 0.635, 0.81 3 1.64 Emissive Bands 4 3.92 5, 6 6.25, 7.35 7 8.70 8 9.66 9,10 10.8, 12.00 11 13.4 land/cld boundaries land/cld properties sfc/cld temp, fires water vapor sfc/cld temp ozone sfc/cld temp cld top properties Figure 1. MODIS and SEVIRI Spectral Response functions (top panels - MODIS orange lines), and bandwidths (bottom two panels – with reference spectrum from standard atmosphere). 1. Use Hydra to load the full disk SEVIRI data (Load->AREA) from 12:45 UTC 16 August 2006 (met8_1234567891011_2006_228_1245_FD.area). Open the Multi-Channel Viewer and use different bands to explore the spectral characteristics of different scenes focusing on the Sahara Desert and the Tropical Land (Figure 2) over Africa in bands .60, .80, 1.60 and 6.20, and 10.80 microns. Figure 2. SEVIRI Full disk image and subset from 12:45 UTC 16 August 2006. 1a. As in lab 2, question 2a, construct a pseudo image of normalized difference vegetation index (NDVI) [Band 2 (0.80 µm) – Band 1 (0.60 µm)]/ [Band 2 (0.80 µm) + Band 1 (0.60 µm)]. What are the NDVI values in regions without significant vegetation? What are they in vegetated regions? How do these results compare with the results you found in lab 3 exercise 2a? What values do clouds have in the NDVI? Why? 1b. What are the strengths and weaknesses of the SEVIRI versus MODIS NDVIs? 2. Close the Multi-Channel Viewer and use Hydra to load in the 12:45 UTC 16 August 2006 data centered over Europe (met8_1234567891011_2006_228_1245.area). Open the MultiChannel Viewer window. In the main Hydra window, select a region centered on the brightest clouds over Northern Italy (see Figure 3). Now load the MODIS image from the same date and time (MYD021KM.A2006228.1245.005.2006231112730.hdf). Open a new Multi-Channel Viewer window and try to center your high resolution selection over the same region as the SEVIRI image. Figure 3. SEVIRI 12:45 UTC Hydra main region and subset of clouds over Northern Italy. 2a. Compare the two instruments in the .60 micron, 6.2 micron, 7.3 micron, 3.9 micron and 10.8 micron bands, considering the size and shape of the cloud, the maximum and minimum temperatures and locations. Use the Multi-Channel Viewer->Arrow tool in the bottom navigation bar to select different portions of the scene. It will also move the collocated pixel in the opposite frame to the same location. Comment on the navigation. What are some reasons for the differences in values that you found between the instruments? Now use Hydra to change the projection of the SEVIRI image to Polar Steriographic (Setting->Change Projection). The image will appear very small in the Multi-Channel window. You will need to zoom in on the image. 2c. Now close Hydra and start it over again. Load in 3 successive SEVIRI areas into 3 different Multi-Channel Viewers from 12:45, 13:00 and 13:15 UTC (met8_1234567891011_2006_228_1245.area, met8_1234567891011_2006_228_1300.area, met8_1234567891011_2006_228_1315.area ) centered over the bright clouds across Northern Italy (Figure 4). You will have to load each image in to the main Hydra window, and then open a new Multi-Channel Viewer after each load. Try to keep them in time order on your monitor. 2d. Convection is defined as the transfer of heat by the movement of matter. In meteorology, the term convection is used where the air is heated by the warm ground, becomes less dense than the surrounding air and rises. If the atmospheric conditions are right, the air will rise until it cools to the dew point and clouds will form. If the rising motion continues, precipitation will form and if the rising motion is strong enough heavy thunderstorms will occur. A technique of detecting where convective cells will occur uses the change in brightness temperatures between a sequence of images to forecast cell growth or dissipation. Figure 4. SEVIRI 12:45 UTC (left), 13:00 UTC (center), and 13:15 UTC 10.8 micron images from 16 August 2006 over a convective cloud system in Northern Italy. After loading in the three images, use the Settings->Color Range sliders to range from ~210 K to 230 K in all three 10.8 micron images. Describe the two cloud scenes in the image, the one covering Northern Italy and the one extending west to east across the lower portion of the image. What similarities and differences are there? Load other bands to help you. Does one of the cloud seem to have convective cells in it? If you found a convective object zoom on it and try to track it in time. What happens to the object: • • • • Area Shape Min temperature Spatial displacement Could you infer the wind speed from the displacement? If yes, how? 2e. Look at the convective cell with a cold top of 220.85 (10.8 micron minimum temperature) in the 12:45 UTC image. Try to track the cell to the 13:00 image, and then to 13:15. What is the delta T ( "T# = T# (t) $ T# (t $1) ) in bands: Tλ Tλ(t-1) Tλ Tλ(t-1) 13:00-12:45 UTC 13:15-13:00 UTC ---------------------------------------------------------------------------------------! i) 10.8 micron ii) 6.2 micron iii) 7.3 micron Remember, the cell is moving from frame to frame will not be in the same location in each frame. 2f. The NEFODINA technique attempts to forecast the brightness temperature of a convective cell by using this formula: T" (t + 1) = T" (t) + #T" in bands the 6.2 micron, 7.3 micron and 10.8 micron. How does this forecast temperature compare with the actual 13:15 UTC brightness temperatures (use only the 13:00-12:45 time period for this calculation)? If you had a precipitating cell would you expect this to grow or dissipate based solely on this example? ! 2g. Look at the convective cell with a cold top at a Latitude around 44.303 and a Longitude of 9.5 in the 12:45 UTC data set. Repeat the steps in exercise 2e and 2f. What is the delta T in bands: Tλ Tλ(t-1) Tλ Tλ(t-1) 13:00-12:45 UTC 13:15-13:00 UTC ---------------------------------------------------------------------------------------a) 10.8 micron b) 6.2 micron c) 7.3 micron 2h. The life phase of a cell is considered “developing” by NEFODINA if TIR = [TIR (t) " TIR (t "1)]/2 < # where α< 0 or α is small and where TWV1 = [TWV1 (t) " TWV1 (t "1)]/2 < 0 . Do simple calculations using your results for the two cases to determine if the convective cells are “developing” or “dissolving”. ! ! 2i. Why is it important to look at both the infrared window and water vapor channels? 2j. If you have QuickTime on your machine, look at the QuickTime loops of MSG data covering the time period 08:30 – 13:30 UTC from this day (on your windows machine, click on the file names - msg_band3.mov, msg_band5.mov, msg_band6.mov and msg_band9.mov). What are the strengths and weaknesses of the geo and leo data sets when it comes to convective forecasting? 3. Close Hydra and then open it again. Load in the MODIS image from 7 August 2006, 11:10 UTC (MOD021KM.A2006219.1110.005.2006220111915.hdf). Select the scene over Northwestern Spain and Northern Portugal as shown in Figure 5. 3a. Load the 7 August 2006, 11:15 UTC SEVIRI area (met8_1234567891011_2006_219_1115.area). Open a new Multi-Channel Viewer and try to select the same region as the MODIS scene, also shown in Figure 5. Figure 5. 7 August 2007 11:10 UTC image of Hydra main window (left) and subset from Terra MODIS (center) and SEVIRI (right). 3b. Load the 3.9 micron bands and into both the SEVIRI and MODIS Multi-Channel Viewer windows (use MODIS band 22). Compare the temperatures in the scene. Again, provide reasons for the differences. Note the locations of the maximum and minimum values. 3c. Create a transect across some of the darkest pixels in the MODIS band 22 scene as shown in Figure 6. What range of values do you observe in the transect? Do you notice anything that looks strange to you? Grab the transect point locater by right clicking and holding down the mouse button on the green point located at the bottom of the transect window X-axis. Move the position to the location along the transect where there seems to be missing data. Why do you think the values are missing? Figure 6. Transect of MODIS data from the 7 August 2007 scene. 3d. Now look at the values in the SEVIRI image by selecting Tools->Transect in the SEVIRI Multi-Channel Viewer and very carefully try to match the transect in the MODIS image. If you are successful, the transect will appear in the same window with the MODIS values. Compare the values. Are there missing values in the SEVIRI data? Change the bands to 11 micron for each instrument. How do these brightness temperatures compare? What are reasons for differences between the instrument bands? 3e. Change the MODIS window back to band 21 (3.99 micron) and select pixels in or near the fire pixels. Look at the brightness temperatures of all the emissive bands. How much higher are the 4 micron bands in this regions than other bands. Now change the units back to radiances and repeat this step. Comment on how the 4 micron channels behave relative to the 11 micron window region values in both brightness temperatures and radiances. 3f. Change the MODIS units back to brightness temperatures. From the MODIS Multi-Channel Viewer, open the Linear Combinations Window and make a single image of Band 21 (3.99 µm) and a combination window of BTDIF4-11 (Band 21(3.99 µm) – Band 31(11 µm)) as shown in Figure 7. Choose the band 21 image as the X-axis and the BTDIF4-11 image as the Y-axis, and create a scatter diagram. Save the scatter diagram by using the Tools->Capture Display option in the scatter diagram window. Identify the regions that have: i) Temperatures less than 300K and small brightness temperatures differences ii) Temperatures ~310-320 K and small brightness temperature differences iii) Temperatures ~300K with large brightness temperature differences and in each case explain why they exhibit these characteristics. Figure 7. Scatter diagram of pixels from 7 August 2007 MODIS scene (right panel) over Spain and Portugal. The scatter diagram was made from the 3.99 micron band (center panel) and the 3.99-11 micron brightness temperature differences (left panel). 3g. Fire detection algorithms often use a series of tests to determine if a pixel contains a fire. Determine where the fire pixels lie on the scatter diagram. If you were to create a fire detection technique for MODIS, what thresholds would you use for an: i). 3.99 micron brightness temperature test ii). 11-4 micron brightness temperature test 3h. Why are the brightness temperatures of fire pixels so different between the 4 and 11 micron windows? 3i. Consider how these things would affect your ability to detect fires: i). Hot surfaces ii). Clouds iii). A really large fire (> 1km ) 3j. Now close the Linear Combinations window. Make sure you have the SEVIRI window units set to brightness temperatures and open up a new Linear Combinations window from the SEVIRI Multi-Channel Viewer. Create a scatter diagram of the 4 micron band on the X-Axis and 4-11 micron brightness temperatures differences on the Y-Axis. Do you recognize the patterns that you saw in the MODIS scatter diagram? You may wish to display the MODIS scatter diagram that you saved. How are these patterns the same? How are they different? 3k. Now apply the fire detection threshold tests that you created in exercise 3g using your MODIS thresholds. Describe your results. 3l. There is a QuickTime movie loop of a sequence of 4 micron SEVIRI images from this day (on your windows machine, click on the file name - msg_ch04.mov). Look at this loop and describe how the MODIS and SEVIRI instruments can complement each other when it comes to fire detection.

![1a. Construct a pseudo image of normalized difference vegetation index... µm) – Band 1 (0.60 µm)]/ [Band 2 (0.80 µm) +...](http://s2.studylib.net/store/data/012410236_1-7979480c1bdf1504a90db6beeb6b315f-300x300.png)


