12 Filtering Recommended Problems
advertisement
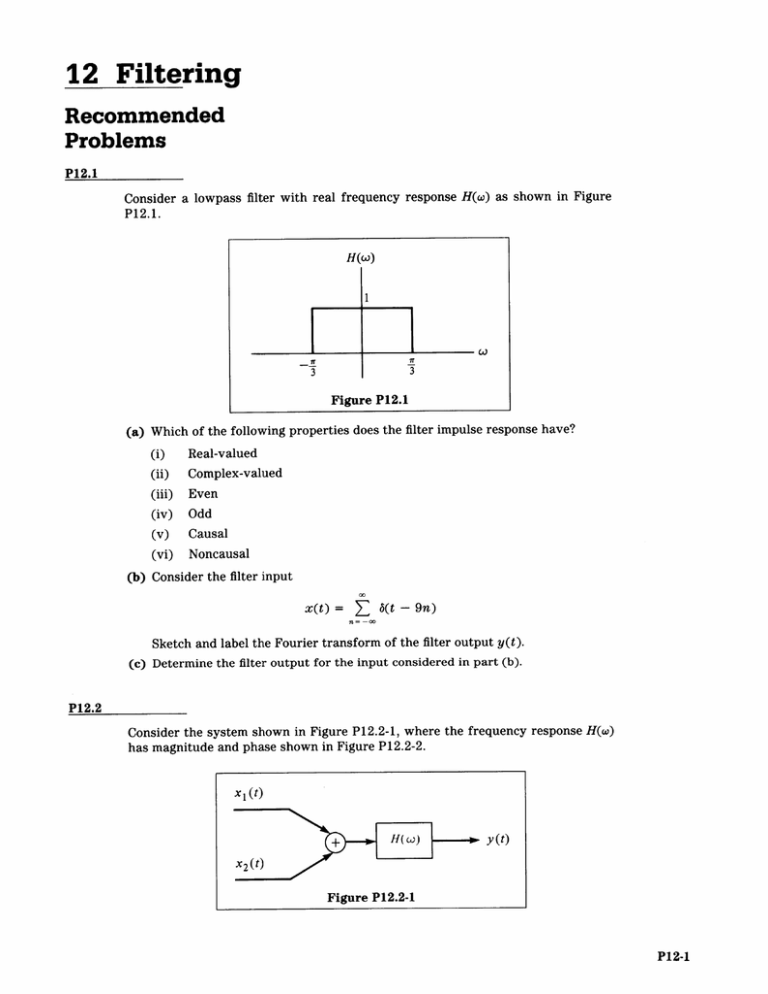
12 Filtering Recommended Problems P12.1 Consider a lowpass filter with real frequency response H(w) as shown in Figure P12.1. H(o) 1 3 3 Figure P12.1 (a) Which of the following properties does the filter impulse response have? (i) (ii) (iii) (iv) (v) (vi) Real-valued Complex-valued Even Odd Causal Noncausal (b) Consider the filter input x(t) = 6 (t - 9n) Sketch and label the Fourier transform of the filter output y(t). (c) Determine the filter output for the input considered in part (b). P12.2 Consider the system shown in Figure P12.2-1, where the frequency response H(w) has magnitude and phase shown in Figure P12.2-2. X1 (t) + H(co) y(t) X2 (t) Figure P12.2-1 P12-1 Signals and Systems P12-2 IH(w)| --4r 41T 4H(w) 2 Figure P12.2-2 xi(t) = sin [wit + (7r/4)] and x 2(t) = 2 cos [w2 t - (r/3)], where wi = 7r and C2 = 27r, write an expression for y(t). P12.3 Consider the first-order RC circuit shown in Figure P12.3-1. + v,(t) ­ C vs(t) R vr(t) Figure P12.3-1 (a) Determine Hi(w), the transfer function from v, to vc, as shown in Figure P12.3-2. Sketch the magnitude and phase of H 1 (w). Vs(t) -- - i e)P2.3(t) Figure P12.3-2 Filtering / Problems P12-3 (b) Evaluate H 2 (W), the transfer function from vs to v,, as shown in Figure P12.3-3. s(t) i r(t) H2( P Figure P12.3-3 Sketch the magnitude and phase of H 2 (w). (c) What are the cutoff frequencies for H1 (w), H 2(w)? (For this problem, the cutoff frequency is defined as the frequency at which the magnitude of the frequency responses is 1/V2 times its maximum value.) (d) Suppose we now consider the system shown in Figure P12.3-4. Sketch V(w)/V,(w). What is the corresponding cutoff frequency? P12.4 Figure P12.4 shows the frequency response H(Q) of a discrete-time differentiator. Determine the output signal y[n] as a function of 90 if the input x[n] is x[n] = cos [Qon + 0] |H( 2)| 4H(92) 71 - fI IT 2 Figure P12.4 K Signals and Systems P12-4 P12.5 Consider the following two LTI systems System 1: y 1[n] = x[n] + x[n - 1] System 2: y2[n] = x[nJ 2 - x[n ­ 2 (a) Without calculating the respective system functions determine the following. (i) Is system 1 a lowpass filter, highpass filter, or bandpass filter? (ii) Is system 2 a lowpass filter, highpass filter, or bandpass filter? Clearly give your reasoning. (b) Calculate the frequency responses H(Q) and H 2(Q) for systems 1 and 2 and plot their magnitudes for the range of 9 between - 2r and 2 1r. P12.6 In the lecture we discussed the use of a moving average as a lowpass filter. Here we study this idea a little more closely. (a) Let 1 N y 1 [n] = 2N+ 1 x[n-k] Find the impulse response h[n]. (b) In eq. (6.15) in the text (page 416), we find that Hi(Q) is given by 1 2N + 1 sn02N + 1 2 sn n . sin ­ Consider a new filter y 2[n] = x[n] - y,[n]. Find H 2 (Q). (c) Plot IHI(O)| and |H2(Q)| on a linear scale, carefully noting where HI(Q) or H 2(Q) equals 1 or 0. (d) What type of filter is H 2 ()? P12.7 We want to design a nonideal continuous-time lowpass filter with the specifications indicated in Figure P12.7. Furthermore, we require that H(0) = 1. We are restricted to designing a filter with a transfer function of the form _K a + jw Filtering / Problems P12-5 1.0 2 2 6 Figure P12.7 (a) Find K such that H(0) = 1. (b) Find the range of values of a such that the resulting filters will meet the specifications in the figure. Optional Problems P12.8 A causal LTI filter has the frequency response H(w) = -2jw. For each of the follow­ ing input signals, determine the filtered output signal y(t). (a) x(t) = e' t (b) x(t) = (sin wt)u(t) 1 (c) XMo) = .wjw + 6) 1 (d) X(w) = .w + 2 P12.9 It was stated in Section 6.4 of the text that for a discrete-time filter to be causal and have exactly linear phase, its impulse response must be of finite length and conse­ quently the difference equation must be nonrecursive. To focus on the insight behind this statement, we consider a particular case for which the slope of the phase is an integer. Thus, the frequency response is assumed to be of the form H(Q) = H,(Q)e -j, -r < <ir, (P12.9-) where H,(Q) is real and even. Let h[n] denote the impulse response of the filter with frequency response H(Q) and hn] denote the impulse response of the filter with frequency response H,(Q). Signals and Systems P12-6 (a) By using the appropriate properties in Table 5.1 of the text (page 335), show the following. (i) h,[fn = h,[-n] (i.e., h,[n] is symmetric about n = 0) (ii) h[n] = h,[n - M] (b) Using the result in part (a), show that with H(Q) of the form in eq. (P12.9-1), h[n] is symmetric about n = M, that is, h[M + n] = h[M - n] (P12.9-2) (c) According to the result in part (b), the linear phase characteristic in eq. (P12.9-1) imposes a symmetry in the impulse response. Show that if h[n] is causal and has the symmetry in eq. (P12.9-2), then h[n] = 0, n<0, n>2M, i.e., it must be of finite length. P12.10 In Figure P12.10-1, we show a discrete-time system consisting of a parallel combi­ nation of N LTI filters with impulse response h,[n], k = 0, 1, . . . , N - 1. For any k, hk[n] is related to hon] by the expression hk[n] = ej(27rnk/N)h 0[nI N -I y[n] - = E Yk [n k =0 Figure P12.10-1 (a) If ho[n] is an ideal discrete-time lowpass filter with frequency response HO(Q) as shown in Figure P12.10-2, sketch the Fourier transforms of hi[n] and hN- 1[n] for 9 in the range -7r < - +7r. (b) Determine the value of the cutoff frequency 9, in Figure P12.10-2 in terms of N (0 <Q, sr) such that the system of Figure P12.10-2 is an identity system; that is, y[n] = x[n] for all n and any input x[n]. Filtering / Problems P12-7 I1 1T Figure P12.10-2 (c) Suppose that h[n] is no longer restricted to be an ideal lowpass filter. If h[n] denotes the impulse response of the entire system in Figure P12.10-1 with input x[n] and output y[n], then h[n] can be expressed in the form h[n] = r[n]ho[n]. Determine and sketch r[n]. (d) From your result in part (c), determine a necessary and sufficient condition on ho[n] to ensure that the overall system will be an identity system (i.e., such that for any input x[n], the output y[n] will be identical to x[n]). Your answer should not contain any sums. P12.11 Consider the system in Figure P12.11-1. + y(t) + x(t) G(w) Figure P12.11-1 Let G(w) be real and have the form shown in Figure P12.11-2. G(o) - -1 -C02 ~1 W1 W2 Figure P12.11-2 Plot the resulting frequency response magnitude and phase for the following cases. (a) a > 1 (b) 1 > a > 0 (c) a < 0 MIT OpenCourseWare http://ocw.mit.edu Resource: Signals and Systems Professor Alan V. Oppenheim The following may not correspond to a particular course on MIT OpenCourseWare, but has been provided by the author as an individual learning resource. For information about citing these materials or our Terms of Use, visit: http://ocw.mit.edu/terms.
