16.30/31 September 17, 2010 Due: September 24, 2010
advertisement
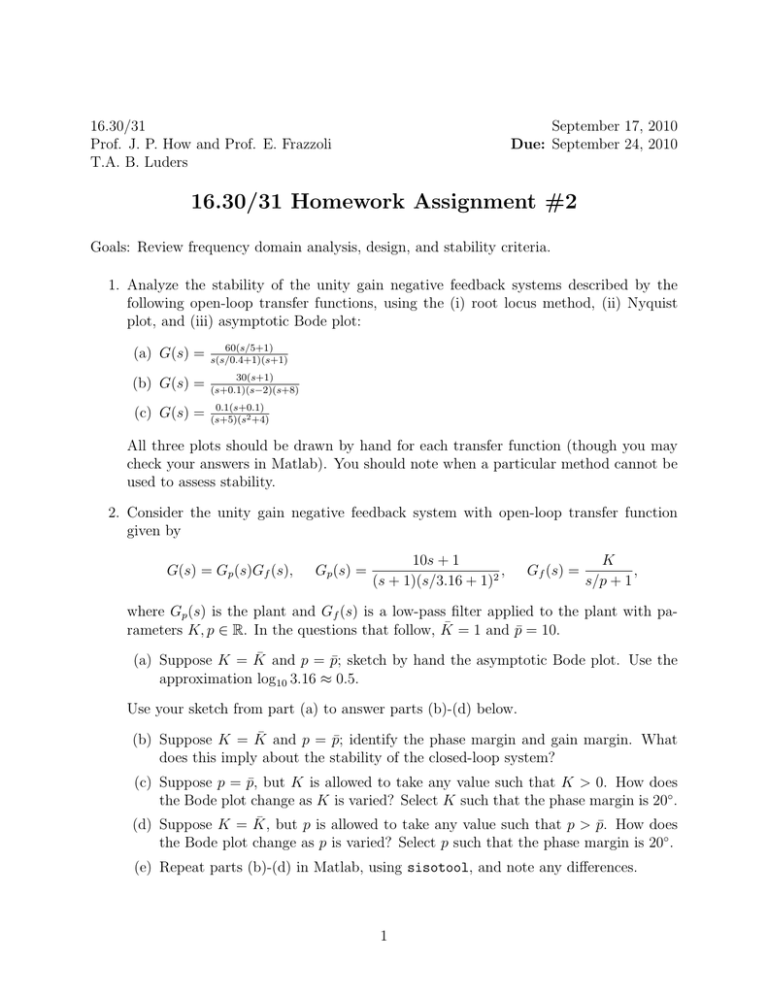
16.30/31 Prof. J. P. How and Prof. E. Frazzoli T.A. B. Luders September 17, 2010 Due: September 24, 2010 16.30/31 Homework Assignment #2 Goals: Review frequency domain analysis, design, and stability criteria. 1. Analyze the stability of the unity gain negative feedback systems described by the following open-loop transfer functions, using the (i) root locus method, (ii) Nyquist plot, and (iii) asymptotic Bode plot: (a) G(s) = 60(s/5+1) s(s/0.4+1)(s+1) (b) G(s) = 30(s+1) (s+0.1)(s−2)(s+8) (c) G(s) = 0.1(s+0.1) (s+5)(s2 +4) All three plots should be drawn by hand for each transfer function (though you may check your answers in Matlab). You should note when a particular method cannot be used to assess stability. 2. Consider the unity gain negative feedback system with open-loop transfer function given by G(s) = Gp (s)Gf (s), Gp (s) = 10s + 1 , (s + 1)(s/3.16 + 1)2 Gf (s) = K , s/p + 1 where Gp (s) is the plant and Gf (s) is a low-pass filter applied to the plant with pa­ rameters K, p ∈ R. In the questions that follow, K̄ = 1 and p̄ = 10. ¯ and p = p̄; sketch by hand the asymptotic Bode plot. Use the (a) Suppose K = K approximation log10 3.16 ≈ 0.5. Use your sketch from part (a) to answer parts (b)-(d) below. ¯ and p = p̄; identify the phase margin and gain margin. What (b) Suppose K = K does this imply about the stability of the closed-loop system? (c) Suppose p = p̄, but K is allowed to take any value such that K > 0. How does the Bode plot change as K is varied? Select K such that the phase margin is 20◦ . ¯ but p is allowed to take any value such that p > p̄. How does (d) Suppose K = K, the Bode plot change as p is varied? Select p such that the phase margin is 20◦ . (e) Repeat parts (b)-(d) in Matlab, using sisotool, and note any differences. 1 3. Problem 8.10 removed due to copyright restrictions.� Van de Vegte, John. Feedback Control Systems. 3rd ed. Prentice Hall, 1993. ISBN: 9780130163790. 4. (16.31 required/16.30 extra credit). In some aerospace applications, the vehicle openloop dynamics exhibit so-called “droop” in closed-loop performance when feedback is applied. Droop refers to poor closed-loop command following in the low- and midfrequency ranges; high-frequency considerations can make this difficult to remedy. Consider the vehicle dynamics with transfer function G(s) = s + 10 GT D (s), (s + 100)(s2 + 10s + 1600) where GT D (s) = e−T s models a time delay of T = 0.02 seconds. Using Matlab, design a compensator that achieves less than 10% error in command following for signals with frequency content up to 0.5 rad/sec. If possible, try to extend this frequency range further - up to 5 rad/sec, or even larger. Motivate your compensator design, and plot the following: i Open-loop Bode plot of your design, with all the compensator poles labeled; ii Closed-loop Bode plot, indicating frequency range which meets the specification; iii Closed-loop unit step response. Consider modeling the time delay as a first-order Padé approximation: e−T s ≈ 1 − T s/2 . 1 + T s/2 See Section 5.7.3 in FPE for more information on incorporating time delays. 2 MIT OpenCourseWare http://ocw.mit.edu 16.30 / 16.31 Feedback Control Systems Fall 2010 For information about citing these materials or our Terms of Use, visit: http://ocw.mit.edu/terms.

