Improving Precision and Interpretability of Meta Analyses Jian Kang ,Timothy Johnson
advertisement

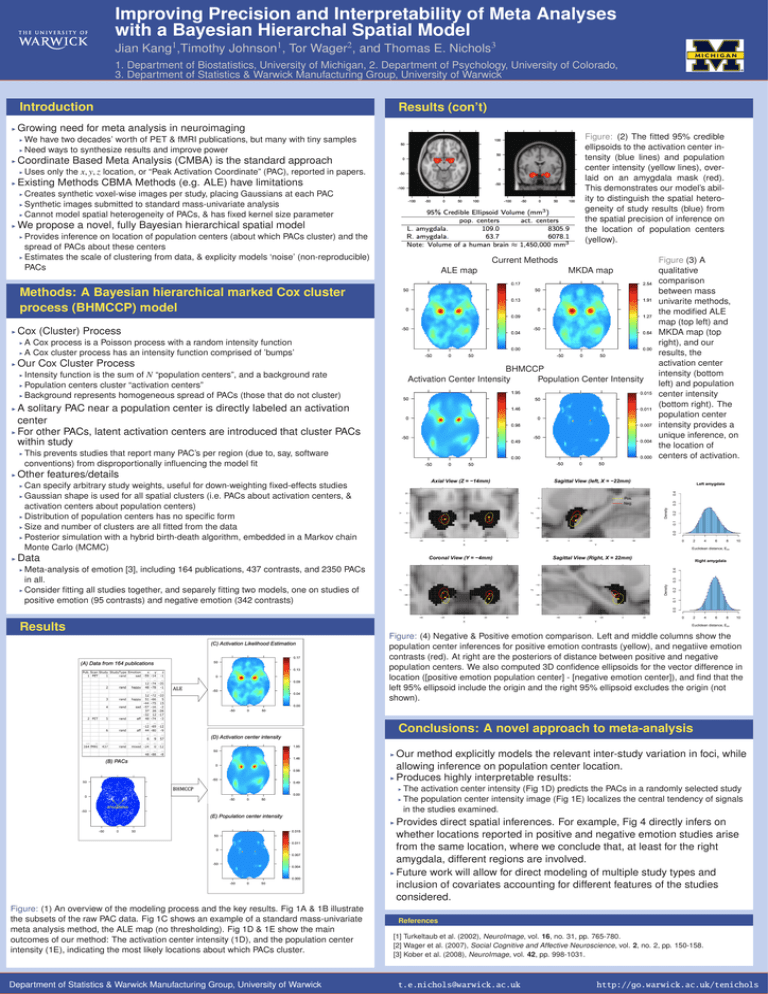
Improving Precision and Interpretability of Meta Analyses with a Bayesian Hierarchal Spatial Model 1 1 2 3 Jian Kang ,Timothy Johnson , Tor Wager , and Thomas E. Nichols 1. Department of Biostatistics, University of Michigan, 2. Department of Psychology, University of Colorado, 3. Department of Statistics & Warwick Manufacturing Group, University of Warwick Introduction I Results (con’t) Growing need for meta analysis in neuroimaging Figure: (2) The fitted 95% credible ellipsoids to the activation center intensity (blue lines) and population center intensity (yellow lines), overlaid on an amygdala mask (red). This demonstrates our model’s ability to distinguish the spatial heterogeneity of study results (blue) from the spatial precision of inference on the location of population centers (yellow). We have two decades’ worth of PET & fMRI publications, but many with tiny samples I Need ways to synthesize results and improve power I I Coordinate Based Meta Analysis (CMBA) is the standard approach I I Uses only the x, y, z location, or “Peak Activation Coordinate” (PAC), reported in papers. Existing Methods CBMA Methods (e.g. ALE) have limitations Creates synthetic voxel-wise images per study, placing Gaussians at each PAC I Synthetic images submitted to standard mass-univariate analysis I Cannot model spatial heterogeneity of PACs, & has fixed kernel size parameter I I We propose a novel, fully Bayesian hierarchical spatial model Provides inference on location of population centers (about which PACs cluster) and the spread of PACs about these centers I Estimates the scale of clustering from data, & explicity models ‘noise’ (non-reproducible) PACs I Current Methods ALE map MKDA map Methods: A Bayesian hierarchical marked Cox cluster process (BHMCCP) model I Cox (Cluster) Process A Cox process is a Poisson process with a random intensity function I A Cox cluster process has an intensity function comprised of ’bumps’ I I Our Cox Cluster Process BHMCCP Activation Center Intensity Population Center Intensity Intensity function is the sum of N “population centers”, and a background rate I Population centers cluster “activation centers” I Background represents homogeneous spread of PACs (those that do not cluster) I A solitary PAC near a population center is directly labeled an activation center I For other PACs, latent activation centers are introduced that cluster PACs within study I I I This prevents studies that report many PAC’s per region (due to, say, software conventions) from disproportionally influencing the model fit Figure (3) A qualitative comparison between mass univarite methods, the modified ALE map (top left) and MKDA map (top right), and our results, the activation center intensity (bottom left) and population center intensity (bottom right). The population center intensity provides a unique inference, on the location of centers of activation. Other features/details Can specify arbitrary study weights, useful for down-weighting fixed-effects studies I Gaussian shape is used for all spatial clusters (i.e. PACs about activation centers, & activation centers about population centers) I Distribution of population centers has no specific form I Size and number of clusters are all fitted from the data I Posterior simulation with a hybrid birth-death algorithm, embedded in a Markov chain Monte Carlo (MCMC) Left amygdala 0.3 0.2 0.0 0.1 Density 0 2 4 6 8 10 Euclidean distance, Epn Data Right amygdala 0.4 Meta-analysis of emotion [3], including 164 publications, 437 contrasts, and 2350 PACs in all. I Consider fitting all studies together, and separely fitting two models, one on studies of positive emotion (95 contrasts) and negative emotion (342 contrasts) 0.0 0.1 Density 0.3 I 0.2 I 0.4 I 0 Results 2 4 6 8 10 Euclidean distance, Epn (C) Activation Likelihood Estimation (A) Data from 164 publications ALE Figure: (4) Negative & Positive emotion comparison. Left and middle columns show the population center inferences for positive emotion contrasts (yellow), and negatiive emotion contrasts (red). At right are the posteriors of distance between positive and negative population centers. We also computed 3D confidence ellipsoids for the vector difference in location ([positive emotion population center] - [negative emotion center]), and find that the left 95% ellipsoid include the origin and the right 95% ellipsoid excludes the origin (not shown). Conclusions: A novel approach to meta-analysis (D) Activation center intensity Our method explicitly models the relevant inter-study variation in foci, while allowing inference on population center location. I Produces highly interpretable results: I (B) PACs The activation center intensity (Fig 1D) predicts the PACs in a randomly selected study I The population center intensity image (Fig 1E) localizes the central tendency of signals in the studies examined. BHMCCP I (E) Population center intensity Provides direct spatial inferences. For example, Fig 4 directly infers on whether locations reported in positive and negative emotion studies arise from the same location, where we conclude that, at least for the right amygdala, different regions are involved. I Future work will allow for direct modeling of multiple study types and inclusion of covariates accounting for different features of the studies considered. I Figure: (1) An overview of the modeling process and the key results. Fig 1A & 1B illustrate the subsets of the raw PAC data. Fig 1C shows an example of a standard mass-univariate meta analysis method, the ALE map (no thresholding). Fig 1D & 1E show the main outcomes of our method: The activation center intensity (1D), and the population center intensity (1E), indicating the most likely locations about which PACs cluster. Department of Statistics & Warwick Manufacturing Group, University of Warwick References [1] Turkeltaub et al. (2002), NeuroImage, vol. 16, no. 31, pp. 765-780. [2] Wager et al. (2007), Social Cognitive and Affective Neuroscience, vol. 2, no. 2, pp. 150-158. [3] Kober et al. (2008), NeuroImage, vol. 42, pp. 998-1031. t.e.nichols@warwick.ac.uk http://go.warwick.ac.uk/tenichols


