A Benchtop Inductively Coupled Plasma Mass Spectrometer
advertisement
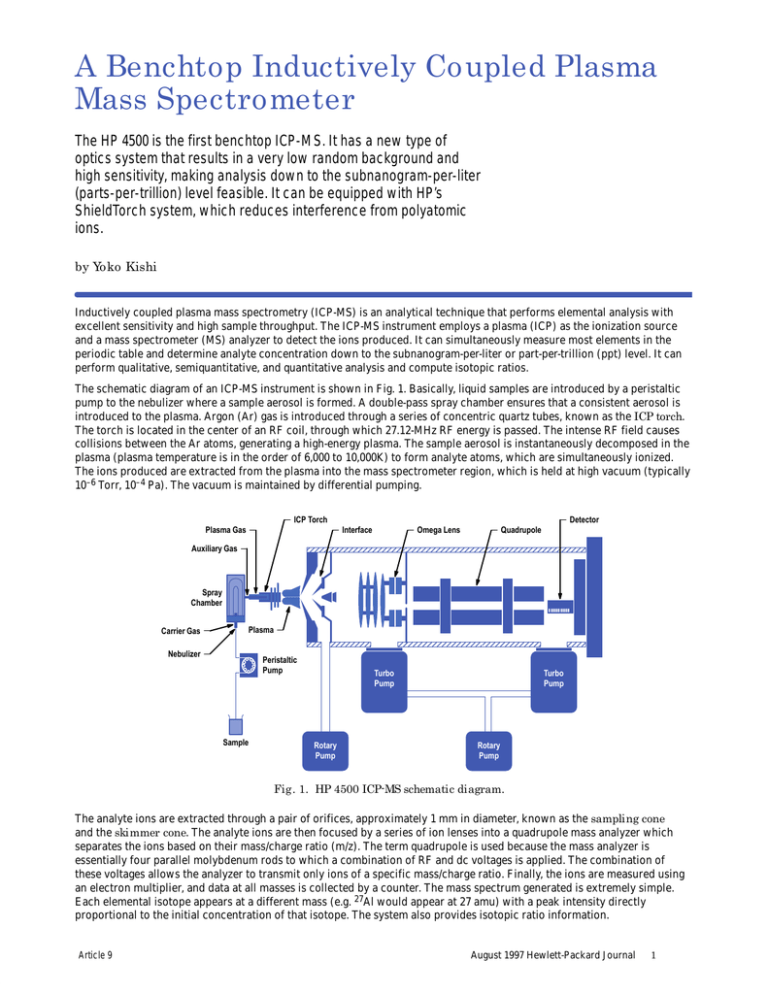
A Benchtop Inductively Coupled Plasma Mass Spectrometer The HP 4500 is the first benchtop ICP-MS. It has a new type of optics system that results in a very low random background and high sensitivity, making analysis down to the subnanogram-per-liter (parts-per-trillion) level feasible. It can be equipped with HP’s ShieldTorch system, which reduces interference from polyatomic ions. by Yoko Kishi Inductively coupled plasma mass spectrometry (ICP-MS) is an analytical technique that performs elemental analysis with excellent sensitivity and high sample throughput. The ICP-MS instrument employs a plasma (ICP) as the ionization source and a mass spectrometer (MS) analyzer to detect the ions produced. It can simultaneously measure most elements in the periodic table and determine analyte concentration down to the subnanogram-per-liter or part-per-trillion (ppt) level. It can perform qualitative, semiquantitative, and quantitative analysis and compute isotopic ratios. The schematic diagram of an ICP-MS instrument is shown in Fig. 1. Basically, liquid samples are introduced by a peristaltic pump to the nebulizer where a sample aerosol is formed. A double-pass spray chamber ensures that a consistent aerosol is introduced to the plasma. Argon (Ar) gas is introduced through a series of concentric quartz tubes, known as the ICP torch. The torch is located in the center of an RF coil, through which 27.12-MHz RF energy is passed. The intense RF field causes collisions between the Ar atoms, generating a high-energy plasma. The sample aerosol is instantaneously decomposed in the plasma (plasma temperature is in the order of 6,000 to 10,000K) to form analyte atoms, which are simultaneously ionized. The ions produced are extracted from the plasma into the mass spectrometer region, which is held at high vacuum (typically 10–6 Torr, 10–4 Pa). The vacuum is maintained by differential pumping. ICP Torch Detector ÎÎÎÎÎÎÎÎÎÎÎÎÎÎÎÎ Plasma Gas Interface Auxiliary Gas Omega Lens Quadrupole Spray Chamber Carrier Gas Plasma Nebulizer ÎÎÎÎÎÎÎÎÎÎÎÎÎÎÎÎ Peristaltic Pump Sample Turbo Pump Rotary Pump Turbo Pump Rotary Pump Fig. 1. HP 4500 ICP-MS schematic diagram. The analyte ions are extracted through a pair of orifices, approximately 1 mm in diameter, known as the sampling cone and the skimmer cone. The analyte ions are then focused by a series of ion lenses into a quadrupole mass analyzer which separates the ions based on their mass/charge ratio (m/z). The term quadrupole is used because the mass analyzer is essentially four parallel molybdenum rods to which a combination of RF and dc voltages is applied. The combination of these voltages allows the analyzer to transmit only ions of a specific mass/charge ratio. Finally, the ions are measured using an electron multiplier, and data at all masses is collected by a counter. The mass spectrum generated is extremely simple. Each elemental isotope appears at a different mass (e.g. 27Al would appear at 27 amu) with a peak intensity directly proportional to the initial concentration of that isotope. The system also provides isotopic ratio information. Article 9 August 1997 Hewlett-Packard Journal 1 New Benchtop ICP-MS The HP 4500 is the world’s first benchtop ICP-MS (see Fig. 2). The reduction in instrument size is dramatic: the size of the previous model is 1550 by 900 by 1450 mm, while that of the HP 4500 is 1100 by 600 by 582 mm. Previous generations of ICP-MS instruments had requirements—space, utilities, and environment—that dictated that a special room be dedicated for the instrument. Installing an ICP-MS could be particularly difficult, since major construction changes were often required. Fig. 2. HP 4500 ICP-MS system. The HP 4500 is smaller and lighter so that it can be installed on an existing bench. The layout of the instrument is designed to make user interaction with the sample introduction system, the interfaces, and the ion lenses routine. All parts can be accessed from the front and connected or disconnected easily. These and other new features and technology introduced and used by the HP 4500 help to make ICP-MS a more routine and therefore a more accessible technique. Ion Lens System The configuration of the ion lens system is one of the key design issues because it directly affects the ion transmission efficiency of an ICP-MS system. Various ion lens configurations were produced and evaluated to determine the optimum configuration and operating conditions for the HP 4500. Ion trajectories through each ion lens system were predicted mathematically. The HP 4500 is equipped with a new type of optics system, as shown in Fig. 3a. The omega lens consists of a pair of crescent-shaped lenses that resemble the Greek letter . The optics system contains two omega lenses, the omega+ and omega– lenses, which bend the ion beam, allowing the quadrupole and detector to be mounted off-axis. This prevents photons from reaching the detector (which would increase random background noise), and also focuses the ions very efficiently. The result is a very low random background and high sensitivity, making ultratrace analysis down to the subnanogram-per-liter level feasible. In contrast, other ICP-MS systems employ a photon stop lens system as shown in Fig. 3b.1 Ions are defocused after extraction into the main vacuum chamber and then refocused, while photons are blocked Front Sampling Cone Back Skimmer Cone Quadrupole Detector Extraction Lenses Einzel Lenses Photons Ions Omega Lenses (a) Sampling Cone Skimmer Cone Quadrupole Detector Photon Stop (b) Fig. 3. Ion lens system. (a) HP 4500 omega lens system. (b) Photon stop system. Article 9 August 1997 Hewlett-Packard Journal 2 by the photon stop. With this design, some ions inevitably collide with the photon stop and are lost, so overall transmission is reduced. An example of ion trajectory mapping for the optics system of Fig. 3a is shown in Fig. 4. In this example, the initial ion energy was estimated at 10 eV and the space-charge effect2 was ignored. The broad trace in the center shows the ion trajectories for the lens voltage settings shown. Starting from the left, the lenses and their voltages are: skimmer cone (no voltage), extraction lens 1 (–160V), extraction lens 2 (–70V), einzel lens 1 (–100V), einzel lens 2 (8V), einzel lens 3 (–100V), omega bias lens (–35V), omega+ lens (4V), omega– lens (–5V), quadrupole focus and plate bias lenses (–10V). The einzel lenses are a traditional electrostatic lens system in which the voltage on the center lens is different from the voltage on the other two lenses. –5V 4V –10V –35V 4V –5V –160V –70V –100V 8V –100V Fig. 4. Example of ion trajectory mapping. Dual-Mode Detection System The dynamic range of the ICP-MS system is extended from six to eight orders of magnitude in the HP 4500 by a newly developed dual-mode detection system. The electron multiplier used in the dual-mode system is a discrete dynode type operated in both pulse count and analog modes. The block diagram of the dual-mode system is shown in Fig. 5. When an ion enters the electron multiplier, it hits the first dynode and a shower of electrons is generated. These electrons hit the next dynode, generating more electrons. Finally, the pulse generated is detected by the collector. This small signal is amplified and a measurable pulse signal is obtained. At this point, the output signal from the amplifier contains both electrical noise and the pulse signal. After the amplifier, the electrical noise is eliminated by a discriminator circuit and pulse signals higher than the discriminator voltage are converted to an ideal pulse shape. This pulse is measured as one count. Ion Deflector Collector Ions Discriminator Counter V/f Converter Counter Pulse Amplifier Electron Multiplier Analog Amplifier Fig. 5. Block diagram of the HP 4500 dual-mode detection system. Article 9 August 1997 Hewlett-Packard Journal 3 At very high analyte concentrations (>1 mg/l in the sample solution), detector saturation occurs, so the dual-mode system is automatically switched to analog mode and the ion current is measured. The ion current is converted to a frequency by a voltage-to-frequency converter and measured as counts per second. The dual-mode detector system extends the maximum working range of the instrument up to approximately 100 mg/l. The appropriate mode for each isotope is selected automatically by the HP ChemStation operating software, and dual-mode data is acquired simultaneously, which is another first for ICP-MS. The great benefit is that samples containing a range of analytes at different concentration levels can be analyzed in a single analysis. Without dual-mode operation, dilution, preconcentration, or other complicated sample preparation and steps would be involved. It is inevitable that as the process for sample preparation gets more complex, an increasing number of errors and contamination will occur. Contamination during sample preparation is always of concern when analyzing elements at trace levels. The ShieldTorch System Although the ICP-MS generates essentially monatomic, positively charged analyte ions, there are still several polyatomic ions such as ArO, ArC, and ArH, which arise mainly from the combination of the argon gas used to generate the plasma with oxygen, carbon, and hydrogen from the air and the samples. The main interferences are shown in Table I. Table I Typical Interferences in ICP-MS Analyte m/z Interferant K 39 38Ar1H Ca 40 40Ar Ca 44 12C16O Cr 52 40Ar12C Fe 56 40Ar16O 2 The HP 4500 can be equipped with HP’s proprietary technology called the ShieldTorch system, which reduces interference from polyatomic ions.3 The electrical model of the plasma and the interface region is shown in Fig. 6. When the plasma is coupled with the RF coil inductively, the plasma has only a slight dc potential. However, there is capacitive coupling between the plasma and the RF coil, which creates a positive plasma potential oscillating at the radio frequency of the plasma source. RF Source E Matching Network t Sampling Cone RF Coil Potential Torch Sample In Shield Plate Ion Energy E t Plasma Potential Skimmer Cone Plasma RF Coil Fig. 6. Electrical model of the plasma and the interface region. Within the plasma, positive ions and electrons exist, since the plasma temperature is high (6,000 to 10,000K). The numbers of positive ions and electrons are essentially equal, so the plasma is electrically neutral. Since the sampling cone is cooled by water, the plasma temperature decreases dramatically when the plasma comes close to the cone. Positive ions and electrons do not exist any more and the neutral Ar atom becomes dominant, creating a “sheath” between the interface and the plasma. Since the plasma potential is grounded to the interface and the vacuum chamber through the sheath, it acts as a condenser Article 9 August 1997 Hewlett-Packard Journal 4 and the charge buildup around the sampling cone results in the formation of a discharge inside the first vacuum stage, commonly called the secondary discharge. The secondary discharge ionizes molecules such as ArO, ArH, and ArAr inside the first vacuum stage, giving rise to interferences with analyte ions at the same nominal mass. When the ShieldTorch system is used, a shield plate is inserted between the torch and the RF coil, eliminating the capacitive coupling between the plasma and the RF coil so that the plasma potential is effectively reduced to zero. As a result, there is no longer a secondary discharge and polyatomic ions are not ionized behind the sampling cone. To reduce the polyatomic ions even further, the plasma temperature is reduced, since these polyatomic ions are also generated in the plasma itself. By lowering the plasma temperature, the ShieldTorch system reduces these interferences dramatically, resulting in improved detection limits down to ng/l or ppt levels for elements such as Fe, Ca, and K—typically three orders of magnitude better than without the ShieldTorch system. Typical spectra with and without the ShieldTorch system are shown in Fig. 7. ArH Intensity 1000 CO2 ArO 500 Ar2 ArC 0 10 (a) 20 30 40 50 60 ArH 1000 70 80 ArO 90 100 Ar2 CO2 Intensity ArC 500 0 (b) 10 20 30 40 50 Mass (amu) 60 70 80 90 100 Fig. 7. Typical spectra of deionized water (a) with and (b) without the ShieldTorch system. HP ChemStation Operating Software The HP ChemStation operating software is easy to learn and use. All instrument parameters are controlled via the HP ChemStation, unlike traditional ICP-MS systems which were completely manual before the introduction of the HP 4500. An example screen from the HP ChemStation is shown in Fig. 8—this is the instrument control screen. A single click of the mouse starts the entire system, while system status is displayed in real time. The HP ChemStation automates day-to-day operation by employing a suite of autotuning routines. Autotuning automatically optimizes the sensitivity, background level, and mass resolution and performs mass calibration. In the tuning screen, the user can select the tuning actions to be performed and the target values for sensitivity, oxide and doubly charged ions, and background. Three masses (typically one each at low, middle, and high mass) are simultaneously adjusted using a proprietary algorithm based on the simplex method.4 Each ion lens voltage is changed to increase the signal of the element that has the weakest relative response (ratio of actual signal to target value) among the three masses until all the signals satisfy the target values. This allows less experienced operators to operate the instrument to its full potential. Applications The HP 4500 ICP-MS offers high-throughput multielement analysis with ng/l (ppt) or better detection limits, very small sample volume requirements, robustness, and ease of use. Therefore, the application areas for the HP 4500 are very wide, from the semiconductor industry in which the concentration of analytes is extremely low, to the environmental, geological, and clinical fields in which high-matrix or “dirty” samples are analyzed. Semiconductor Sample Analysis. The trend towards pattern miniaturization and ultra large-scale integration (ULSI) in semiconductor devices requires the lowering of the level of metallic impurities present. In recognition of the need for higher-purity chemicals to meet the needs of submicrometer device production, the SEMI Process Chemicals Committee has proposed several grades for each chemical. Hydrogen peroxide, H2O2, is widely used to remove metallic, organic, and particulate contaminants from wafer surfaces during the semiconductor manufacturing process. The H2O2 must be of extremely high purity to avoid contamination of the wafer surface by the cleaning solution itself. The specification for H2O2 (30-32%) in the SEMI Tier C Guidelines (the quality needed to produce ICs whose critical dimensions lie in the range of 0.09 to 0.2 mm or greater) stipulates that the maximum Article 9 August 1997 Hewlett-Packard Journal 5 Fig. 8. Example screen from the HP 4500 ChemStation. concentration of impurities should be 100 ng/l (ppt) for a suite of 18 metals. Table II shows the results of a quantitative purity analysis of H2O2 (30%). Until now, recovery data presented to the Process Chemicals Committee by member companies has involved the use of ICP-MS followed by graphite furnace atomic absorption spectroscopy (GFAAS) for Ca and Fe. The HP 4500 with the ShieldTorch system can determine even Fe, K, and Ca at low ppt levels not normally possible by quadrupole ICP-MS because of interferences from polyatomic ions and isobars such as ArO, ArH and Ar. Table II also shows the recovery results at the 50 ng/l (ppt) level. The recoveries of all of the elements were well within SEMI Tier C Guidelines, which stipulate that recovery data must be obtained showing 75 to 125% recoveries for all metals. Environmental Sample Analysis. Concerns regarding safe levels of contaminants in the environment, particularly heavy metals, continue to grow. The requirement for analysis of more elements at ever-decreasing concentrations is exposing the limitations of currently used analytical techniques. ICP-MS is the only technique that offers the improvements in sensitivity that will be demanded in the near future. ICP-MS is approved for several environmental analytical methods including those developed by the U.S. Environmental Protection Agency (EPA). Fig. 9 demonstrates the qualitative spectrum of river water standard reference material (SLRS-3). A large number of elements, ranging from lithium (Li) at low mass to uranium (U) at high mass can be clearly observed, even though the total analysis time was only 100 seconds. Table III shows HP 4500 ICP-MS quantitative results, which are in excellent agreement with the certified values. The dual-mode detection system allows the user to quantitate the analytes from a few tens of ng/l (ppt) to the mg/l (ppm) level. Clinical Sample Analysis. The determination of toxic elements such as mercury (Hg), lead (Pb) and cadmium (Cd) in humans has been a critical issue in the field of clinical chemistry from the toxicology viewpoint. In addition, since recent biomedical research has shown that some elements at trace levels have specific functions in the biochemistry of living organisms, the determination of trace element concentrations in human beings has also become a major issue in the field of nutritional study. As a result, the analysis of toxic elements and also many trace elements in biological samples is required. The analyte concentration range is large, ranging from the trace levels normally found in the body to the high levels resulting from industrial exposure. Since medical treatment regimes for hospital patients depend on the analytical results reported, the analysis of biomedical samples is critical. Therefore, the need for fast and reliable analytical methods and instrumentation is paramount. Table IV shows the HP 4500 ICP-MS quantitative results for human hair standard reference material (NIES No. 5) which was decomposed by a microwave sample preparation system. The concentrations of 11 elements analyzed were in good agreement for all the elements that had certified values (there is no certified value for As). Article 9 August 1997 Hewlett-Packard Journal 6 Na Mg Al Intensity 5000 K Ca Mn Fe Rb Sr B 2500 Cu Br Li V Ni Zn As 0 10 20 Intensity 200 I 30 40 50 70 80 90 100 140 150 160 170 Rare Earth Elements 180 190 200 Ba 60 Sb 100 0 110 120 130 Intensity 200 100 U Pb Th 0 210 220 230 Mass (amu) 240 250 260 Fig. 9. Qualitative spectrum of river water reference material. Table II Quantitative Results for Hydrogen Peroxide (30%) Element B Na Mg Al K Ca Ti Cr Mn Fe Ni Cu Zn As Sn Sb Au Pb Article 9 Concentration Detection (ng/l) Limit (ng/l) 188 4.7 8 9 not detected 34 14 2 1.3 9 6.5 2.6 8 12 4.4 3.1 7 3.4 4 0.5 2 3 0.02 4 2 1 0.1 1 0.6 0.4 1 0.7 0.5 0.5 2 0.3 Recovery (%) 96 102 97 102 101 109 98 101 102 106 98 102 101 115 102 104 100 98 August 1997 Hewlett-Packard Journal 7 Table III Quantitative Results for River Water Element Certified Concentration (g/l) Measured Concentration (g/l, N = 3) Be Na Mg Al K Ca V Cr Mn Fe Co Ni Cu Zn As Sr Mo Cd Sb Ba Pb U 0.0050.001 2300200 1600200 313 700100 6000400 0.30.02 0.30.04 3.90.3 1002 0.0270.003 0.830.08 1.350.07 1.040.09 0.720.05 28.1* 0.190.01 0.0130.002 0.120.01 13.40.6 0.0680.007 0.045* 0.00510.0004 226030 145010 32.30.5 70030 572010 0.3030.004 0.3030.003 3.700.07 98.70.5 0.02880.0002 0.7690.003 1.390.02 1.010.00 0.6970.007 30.10.2 0.1930.005 0.01250.0002 0.1270.001 13.30.1 0.0600.003 0.04130.0008 * Not certified, information value only. N is the number of repetitions. Table IV Quantitative Results for Human Hair Element Certified Concentration (g/g) Measured Concentration (g/g) Detection Limit (g/g) Al Cr Mn Fe Ni Cu Zn As Se Cd Hg Pb 240* 1.40.2 5.20.3 2259 1.80.1 16.31.2 16910 ** 1.4* 0.20.03 4.40.4 6.0* 2206 1.720.07 5.470.13 2195 1.870.06 16.70.6 1714 0.180.02 2.40.3 0.210.03 4.520.15 5.980.11 0.003 0.004 0.001 0.9 0.004 0.002 0.004 0.02 0.004 0.0002 0.003 0.0007 * Not certified, information value only. ** Not certified. Solid Sample Analysis. Solutions and liquids are the normal sample types measured by ICP-MS. Solid samples are normally digested using mineral acids and analyzed as solutions. However, solid samples such as glass can be analyzed directly using the laser ablation system. The schematic diagram of this system is shown in Fig. 10. A sample is placed in the sample cell and ablated by the beam from a Nd:YAG laser operating at 266 nm. The fine aerosol generated is carried directly to the plasma by Ar carrier gas. Fig. 11 shows qualitative data for glass standard reference material (NIST 614). Group 1 and 2 elements, transition metals, rare earth elements, and actinides can be clearly seen from a two-minute analysis, even though the concentration of most elements was at the mg/kg (ppm) level or lower in the glass. Article 9 August 1997 Hewlett-Packard Journal 8 CCD Camera HP ChemStation Laser Inductively Coupled Plasma Power Supply Ar Sample Cell Fig. 10. Schematic diagram of laser ablation system. 1000 Mg Li Ti Mn Fe Zn Rb Sr Intensity Ga Cr B 500 Co Mo 0 10 20 Intensity 1000 30 Ba Sn 40 50 60 70 80 90 100 In 500 Pd Ta Hg Ag Au W 0 110 120 130 140 Intensity 1000 Pb 500 150 160 170 Rare Earth Elements 180 190 200 U Bi Th Tl 0 210 220 230 240 250 260 Mass (amu) Fig. 11. Qualitative spectrum of glass reference material. In addition to the bulk analysis capability shown, this technique also has the capability to analyze sample features and inclusions as small as 10 mm in diameter. Speciation Analysis. Organotin compounds have been widely used for a variety of commercial applications. Trialkyltin compounds have been used for antifouling paints for ships and fish traps. Dialkyltin has been used for polymerization catalysts. Currently, there is growing concern about their effects on the environment. Methods to determine the species of tin (Sn) and the total amount of Sn present are required, since the toxicity of organotin compounds varies widely with the number and types of organic groups attached to the Sn atom. The combination of ICP-MS and chromatography has the ability to perform speciation analysis with high selectivity and sensitivity. Fig. 12 shows a chromatogram of six organotin compounds obtained by the HP 4500 ICP-MS combined with the HP 1050 liquid chromatograph. Each organotin compound was separated clearly within a total run time of 20 minutes. Detection limits obtained were 24 to 51 pg as Sn. Article 9 August 1997 Hewlett-Packard Journal 9 50,000 Intensity TMT DMT 25,000 DPT TPT DBT TBT 0 0 200 400 600 800 Time (s) 1000 1200 1400 Fig. 12. Chromatogram of six organotin compounds: trimethyltin (TMT), dimethyltin (DMT), diphenyltin (DPT), triphenyltin (TPT), dibutyltin (DBT), tributyltin (TBT). Summary The HP 4500 ICP-MS offers high sensitivity, low background, a wide dynamic range, and the reduction of polyatomic ions, even though its benchtop size is only one fifth the size of the previous model. It is designed for routine use, easy operation, and easy maintenance. With these features, the HP 4500 is ideal for a wide range of applications in the semiconductor industry, environmental studies, laboratory research, plant quality control, and other areas. Acknowledgments The author wishes to acknowledge all of the different teams who contributed to the development of the HP 4500. Thanks to Don Potter and Toshiaki Matsuda for reviewing this paper and providing many helpful suggestions. References 1. A.L. Gray, “The Origins, Realization, and Performance of ICP-MS Systems,” Applications of Inductively Coupled Plasma Mass Spectroscopy, A.R. Date and A.L. Gray, editors, Blackie and Son Ltd., 1989. 2. K.E. Jarvis, A.L. Gray, and R.S. Houk, Handbook of Inductively Coupled Plasma Mass Spectrometry, Blackie Academic and Professional, 1992. 3. K. Sakata and K. Kawabata, “Reduction of fundamental polyatomic ions in inductively coupled plasma mass spectrometry,” Spectrochimica Acta, Vol. 49B, no. 10, 1994, pp. 1027-1038. 4. M.A. Sharaf, D.L. Illman, and B.R. Kowalski, Chemometrics, John Wiley & Sons, Inc., 1986. Article 9 Go to Next Article Go to Journal Home Page August 1997 Hewlett-Packard Journal 10
