Optimal Power Flow Control on Power System Transmission Network using UPFC
advertisement
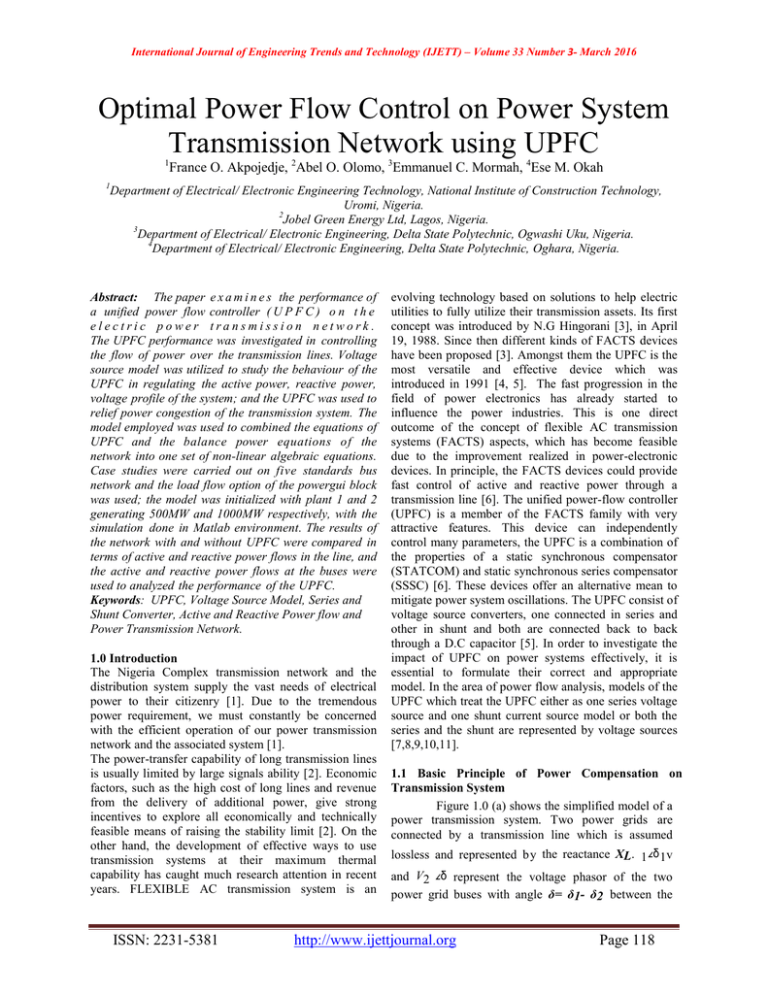
International Journal of Engineering Trends and Technology (IJETT) – Volume 33 Number 3- March 2016 Optimal Power Flow Control on Power System Transmission Network using UPFC 1 France O. Akpojedje, 2Abel O. Olomo, 3Emmanuel C. Mormah, 4Ese M. Okah 1 Department of Electrical/ Electronic Engineering Technology, National Institute of Construction Technology, Uromi, Nigeria. 2 Jobel Green Energy Ltd, Lagos, Nigeria. 3 Department of Electrical/ Electronic Engineering, Delta State Polytechnic, Ogwashi Uku, Nigeria. 4 Department of Electrical/ Electronic Engineering, Delta State Polytechnic, Oghara, Nigeria. Abstract: The paper e x a m i n e s the performance of a unified power flow controller ( U P F C ) o n t h e electric power transmission network. The UPFC performance was investigated in controlling the flow of power over the transmission lines. Voltage source model was utilized to study the behaviour of the UPFC in regulating the active power, reactive power, voltage profile of the system; and the UPFC was used to relief power congestion of the transmission system. The model employed was used to combined the equations of UPFC and the balance power equations of the network into one set of non-linear algebraic equations. Case studies were carried out on five standards bus network and the load flow option of the powergui block was used; the model was initialized with plant 1 and 2 generating 500MW and 1000MW respectively, with the simulation done in Matlab environment. The results of the network with and without UPFC were compared in terms of active and reactive power flows in the line, and the active and reactive power flows at the buses were used to analyzed the performance of the UPFC. Keywords: UPFC, Voltage Source Model, Series and Shunt Converter, Active and Reactive Power flow and Power Transmission Network. 1.0 Introduction The Nigeria Complex transmission network and the distribution system supply the vast needs of electrical power to their citizenry [1]. Due to the tremendous power requirement, we must constantly be concerned with the efficient operation of our power transmission network and the associated system [1]. The power-transfer capability of long transmission lines is usually limited by large signals ability [2]. Economic factors, such as the high cost of long lines and revenue from the delivery of additional power, give strong incentives to explore all economically and technically feasible means of raising the stability limit [2]. On the other hand, the development of effective ways to use transmission systems at their maximum thermal capability has caught much research attention in recent years. FLEXIBLE AC transmission system is an ISSN: 2231-5381 evolving technology based on solutions to help electric utilities to fully utilize their transmission assets. Its first concept was introduced by N.G Hingorani [3], in April 19, 1988. Since then different kinds of FACTS devices have been proposed [3]. Amongst them the UPFC is the most versatile and effective device which was introduced in 1991 [4, 5]. The fast progression in the field of power electronics has already started to influence the power industries. This is one direct outcome of the concept of flexible AC transmission systems (FACTS) aspects, which has become feasible due to the improvement realized in power-electronic devices. In principle, the FACTS devices could provide fast control of active and reactive power through a transmission line [6]. The unified power-flow controller (UPFC) is a member of the FACTS family with very attractive features. This device can independently control many parameters, the UPFC is a combination of the properties of a static synchronous compensator (STATCOM) and static synchronous series compensator (SSSC) [6]. These devices offer an alternative mean to mitigate power system oscillations. The UPFC consist of voltage source converters, one connected in series and other in shunt and both are connected back to back through a D.C capacitor [5]. In order to investigate the impact of UPFC on power systems effectively, it is essential to formulate their correct and appropriate model. In the area of power flow analysis, models of the UPFC which treat the UPFC either as one series voltage source and one shunt current source model or both the series and the shunt are represented by voltage sources [7,8,9,10,11]. 1.1 Basic Principle of Power Compensation on Transmission System Figure 1.0 (a) shows the simplified model of a power transmission system. Two power grids are connected by a transmission line which is assumed lossless and represented by the reactance XL. 1 ∠δ 1v and V2 ∠δ represent the voltage phasor of the two power grid buses with angle δ= δ1- δ2 between the http://www.ijettjournal.org Page 118 International Journal of Engineering Trends and Technology (IJETT) – Volume 33 Number 3- March 2016 two. The corresponding phasor diagram is shown in Figure 1.0 (b). controlling the voltages, phase angles and line impedance of the transmission system. From the power angle curve shown in Figure 2 (c), the active power flow will reach the maximum when the phase angle δ is 90º. In practice, a small angle is used to keep the system stable from the transient and dynamic oscillations [13]. Generally, the compensation of transmission systems can be divided into two main groups: shunt and series compensation. Figure 1.0 Power transmission system: (a) simplified model; (b) phase diagram [12]. 1.2 Shunt Compensation Shunt compensation especially shunts reactive compensation has been widely used in transmission system to regulate the voltage magnitude, improve the voltage quality, and enhance the system stability [12]. Shunt-connected reactors are used to reduce the line over-voltages by consuming the reactive power while shunt-connected capacitors are used to maintain the voltage levels by compensating the reactive power to the transmission line [15]. A simplified model of a transmission system with shunt compensation is shown in Figure 2 (a). The voltage magnitudes of the two buses are assumed equal as V, and the phase angle between them is δ. The transmission line is assumed lossless and represented by the reactance XL. At the midpoint of the transmission line, a controlled capacitor C is shunt- connected. The voltage magnitude at the connection point is maintained as V [15]. The magnitude of the current in the transmission line is given by: (1) The active and reactive components of the current flow at bus 1 are given by: (2) The active power and reactive power at bus 1 are given by: (3) Similarly, the active and reactive components of the current flow at bus 2 is given by: (4) The active power and reactive power at bus 2 are given by: Figure 2 : Transmission system with shunt compensation: (a) simplified model; (b) phase diagram; (c) power-angle curve [14]. (5) Equations (1) through (5) indicate that the active and reactive power/current flow can be regulated by ISSN: 2231-5381 As discussed previously, the active powers at bus 1 and bus 2 are equal [15]. http://www.ijettjournal.org Page 119 International Journal of Engineering Trends and Technology (IJETT) – Volume 33 Number 3- March 2016 (6) T h e i njected reactive power by the capacitor to regulate the voltage at the mid-point of the transmission line is calculated as: (7) From the power angle curve shown in Figure 2 (c), the transmitted power can be significantly increased, and the peak point shifts from δ=90º to δ=180º. The operation margin and the system stability are increased by the shunt compensation. The voltage support function of the midpoint compensation can easily be extended to the voltage support at the end of the radial transmission, which will be proven by the system simplification analysis in a later section of this paper. The reactive power compensation at the end of the radial line is especially effective in enhancing voltage stability. 1.3 Series Compensation Series compensation aims to directly control the overall series line impedance of the transmission line [15]. Tracking back to Equations (1) through (5), the AC power transmission is primarily limited by the series reactive impedance of the transmission line [15]. A series-connected can add a voltage in opposition to the transmission line voltage drop, thereby reducing the series line impedance [15]. A simplified model of a transmission system with series compensation is shown in Figure 3(a) [15]. The voltage magnitudes of the two buses are assumed equal as V, and the phase angle between them is δ [15]. The transmission line is assumed lossless and represented by the reactance XL. A controlled capacitor is series-connected in the transmission line with voltage addition Vinj. The phase diagram is shown in Figure 3(b) [15]. Figure 3: Transmission system with series compensation: (a) simplified model; (b) phase diagram; (c) power-angle curve [14] Defining the capacitance C as a portion of the line reactance, X C = kX L (8) The overall series inductance of the transmission line is, (9) The active power transmitted is, (10) The reactive power supplied by the capacitor is calculated as: (11) Figure 3(c) shows the power angle curve from which it can be seen that the transmitted active power increases with k. 1.4 The Operating Principle of UPFC A simplified scheme of a UPFC connected to an infinite bus via a transmission line is shown in Figure 4. UPFC consists of parallel and series branches, each one containing a transformer, power-electric converter with turn-off capable semiconductor devices and DC circuit. Inverter 2 is connected in series with the transmission line by series transformer. The real and reactive power ISSN: 2231-5381 http://www.ijettjournal.org Page 120 International Journal of Engineering Trends and Technology (IJETT) – Volume 33 Number 3- March 2016 in the transmission line can be quickly regulated by changing the magnitude and phase angle of the injected voltage produced by inverter 2. The basic function of inverter 1 is to supply the real power demanded by inverter 2 through the common DC link. Inverter 1 can also generate or absorb controllable power [12, 4]. An attempt is made in this paper to simulate and implement UPFC system. (14) Where and The element of transfer admittance matrix can be put as: (15) Figure 4: UPFC Installed in a Transmission Line[16] 1.6 Mathematical Modeling of UPFC Figure 5: Voltage Source Model of UPFC [17]. The two ideal voltage sources of the UPFC can be mathematically modeled as: The UPFC converters are assumed lossless in this voltage sources model. This implies that there is no absorption or generation of active power by the two converters for its losses and the active power demanded by the series converter at its output is supplied from the AC Power system by the shunt converters via the common D.C link. The DC link capacitor voltage Vdc remains constant. Hence the active power supplied to the shunt converter Psh must be equal to the active power demanded by the series converter Pse at the DC link. Then the following equality constraint has to be guaranteed. (16) From Figure 5 and by equation (11), (12), (13) for the series and shunt sources the power equations of UPFC can be written (12) (13) UPFC is connected between two buses k and m in the power system. Applying the Kirchhoff‟s current and voltage laws for the network in Figure 4 gives: (17) (18) ISSN: 2231-5381 http://www.ijettjournal.org Page 121 International Journal of Engineering Trends and Technology (IJETT) – Volume 33 Number 3- March 2016 1.5 Test System and Implementation Figure 6: A Single-line diagram of the modeled electric power transmission network [16] The UPFC is used to control the power flow on a 500 kV /230 kV transmission network or system. The system connected in a loop configuration, consists of essentially five buses (B1 to B5) interconnected through transmission lines (L1, L2, L3) and two 500 kV/230kV transformer banks T1 and T2 [16]. Two power plants located on the 230kV system generate a total of 1500MW which is transmitted to a 500kV, 15000MVA equivalent and to a 200MW load connected at bus B3 [16]. The plant models include a speed regulator, an excitation system as well as a power system stabilizer (PSS). In normal operation, most of the 1200MW generation capacity of power plant 2 is exported to the 500kV equivalent through three 400MVA transformers connected between buses B4 and B5 [16]. For this study we are considering a contingency case where only two transformers out of three are available (T2= 2*400MVA = 800 MVA). Figure 7 show the Matlab/simulink model of the test system. Using the load flow option of the powergui block, the model is initialized with plants 1 and 2 generating 500MW and 1000MW respectively and the UPFC out of service. The resulting power flow obtained at buses B1 to B5 is indicated by red numbers on the circuit diagram in figure 7 below. The load flow shows that most of the power generated by plant 2 is transmitted through the 800MVA transformer bank (899MW out of 1000MW), the rest (101MW), circulating in the loop. Transformer T2 is therefore overloaded by 99 MVA. The study illustrates how the UPFC can relieve this power congestion. Figure 7: The Matlab/Simulink Model of the Test System The UPFC located at the right end of line L2 is used to control the active and reactive powers at the 500kV bus B3, as well as the voltage at bus B_UPFC. It consists of a phasor model of two ISSN: 2231-5381 100MVA, IGBT-based, converters (one connected in shunt and one connected in series and both interconnected through a DC bus on the DC side and to the AC power system, through coupling reactors http://www.ijettjournal.org Page 122 International Journal of Engineering Trends and Technology (IJETT) – Volume 33 Number 3- March 2016 and transformers). The series converter can inject a maximum of 10% of nominal line-to-ground voltage (28.87 kV) in series with line L2. The blue numbers on the diagram show the power flow with the UPFC in service and controlling the B3 active and reactive powers respectively at 687MW and -27Mvar. 4.0 Results Analysis The UPFC reference active and reactive power are set in the modeled blocks Pref (pu) and Qref (pu). Initially the Bypass breaker is closed and the resulting natural power flow at bus B3 is 587MW and -27Mvar. The Pref block is programmed with an initial active power of 5.87pu corresponding to the natural flow. Then, at t = 10s, Pref is increased by 1pu (100MW), from 5.87pu to 6.87pu, while Qref is kept constant at -0.27pu as shown in Figure 8 and Figure 9 respectively. The P and Q measured at bus B3 follow the reference values as shown in Figure 13 and Figure 14. At t = 5s, when the Bypass breaker is opened the natural power is diverted from the Bypass breaker to the UPFC series branch without noticeable transient. At t =10s, the power increases at a rate of 1 pu/s. It takes one second for the power to increase to 687MW as seen in Figure 8. The 100MW increase of active power at bus B3 is achieved by injecting a series voltage of 0.089pu with an angle of 94 degrees, this is shown in Figure 10 and Figure 11 respectively. This resulted in an approximate 100MW decrease in the active power flowing through T2 (from 899MW to 796MW), which now carries an acceptable load. See the variations of active powers at buses B1 to B5 on the VPQ Lines scope, Figure 12 show the Bus voltages. The UPFC P and Q signals vary according to the changing phase of the injected voltage. The trajectory of the UPFC reactive power as a function of its active power, measured at bus B3 is shown in Figure 15. The area located inside represents the UPFC controllable region. TABLE I: Bus Voltages and Power With and Without UPFC Bus No. 1 2 3 4 5 Bus Voltage Without UPFC Voltages ( pu) Bus Voltage With UPFC Voltages ( pu) Bus Power Without UPFC Bus Power With UPFC P (MW) 0.9966 0.9993 0.9996 0.9926 0.9978 0.9967 1.0020 1.0010 0.9942 0.9978 95 589 587 899 1279 P (M W) 197 690 687 796 127 7 Q (Mv ar) -16 -64 -27 27 106 Figure 8: Pref Signal Figure 9: Qref Signal Figure 10: Injected Series Voltage Q (Mv ar) -30 -94 -27 16 -89 Figure 11: Injected Series Voltage Phase Angle ISSN: 2231-5381 http://www.ijettjournal.org Page 123 International Journal of Engineering Trends and Technology (IJETT) – Volume 33 Number 3- March 2016 Q (pu) Figure 12: Bus Bar Voltages Figure 15: UPFC Controllable Region Figure 13: Bus bar Active Power 5.0 Conclusion The simulation study carried out in matlab/simulink P (pu) environment was used to simulate the model of UPFC connected to a 3 phase system. This study presents the control and performance of the UPFC used for optimal power flow in a power transmission network and voltage compensation was done using UPFC as a studied as well. The real and reactive power increase with the increase in angle of injection. The simulation results shows the effectiveness of UPFC to control the real and reactive power in the system. It is found that there is an improvement in the real and reactive power through the transmission lines when UPFC is introduced. The UPFC system has the advantages to reduced maintenance and the ability to control real and reactive power in the network. References [1] [2] Figure 14:Bus Bar Reactive Power [3] [4] ISSN: 2231-5381 F.O. Akpojedje, et al, ''A Comprehensive Review of Nigeria Electric Power Transmission Issues and Rural Electrification Challenges'', International Journal of Engineering Trends and Technology (IJETT), Vol. 31, No. 1 January 2016. Pg. 1. Ch. Chengiaiah, et al., ''Power Flow Assessment in Transmission Lines Using Simulink Model with UPFC'', International Conference on Computing, Electronics and Electrical Technologies'', 21 - 22 March, 2012, Pg. 151 - 155. Ch. K. Kumar, ''A Comparative Analysis of UPFC as a Power Flow Controller with Applications'', IOSR Journal of Electrical and Electronics Engineering (IOSR - JEEE), eISSN: 2278 - 1676, Vol. 4, Issue 6, March - April 2013, Pg. 53 - 61. www. iosrjournals.org L. Gyugyi, ”Unified power flow controller concept for flexible AC Transmission system”, IEE Proceedings-C Vol139, No.4, Pg. 323-331 July 1992. http://www.ijettjournal.org Page 124 International Journal of Engineering Trends and Technology (IJETT) – Volume 33 Number 3- March 2016 [5] [6] [7] [8] [9] [10] [11] [12] [13] [14] [15] [16] [17] L. Gyugyi, et al. ''The unified power flow controller: A new Approach to power transmission control”, IEEE Trans on Power Delivery Vol.10, No.2, Pg. 1085-1097 April 1995. C.D. Schaulder et al., “Operation of Unified Power Flow Controller (UPFC) Under Practical Constraints‟, IEEE Trans. Power Del., Vol.13, No.2. Pg. 630-639, April 1998. C. R. Fuerte-Esquivel, and E. Acha, „Incorporation of UPFC Model in an Optimal Power Flow using Newtons Method‟, IEE Proc. –Gen- Transm. Dristrib., Vol. 145, No.3, May 1998, Pg. 336-344. M. Noroozian, L. Angquist, M. Ghandhari, and G.Anderson, „Use of UPFC for optimal power flow control‟. IEEE IKTH Stockholm Power tech conference, Stockholm, Sweden, 1995, Pg. 506-511. A. Nabavi-Niaki, M.R. Iravani, „Steady-State and Dynamic Models of Unified Power Flow IEEE Trans. on Power Systems, Vol. 11, No. 4, Nov. 1996, pg. 1937-1943. Y. H. Song, J.Y. Liu, P.A. Mehta, „Power injection modeling and optimal multiplier power flow algorithm for steady-state studies of unified power flow controllers‟, Electric Power System Research, Vol.52,1999, Pg. 51-59. Nemat-Talebi et al, “An efficient Power injection modeling and sequential power flow Algorithm for FACTS Devices”, IEEE 0-7803, 2004 IEEE. L. Gyugyi, “Unified power-flow control concept for flexible AC transmission system,” Proc. Inst. elect. Eng. C, Vol. 139, No.4, Pg. 323-331, Jul, 1992. L. Gyugyi, “Application characteristics of converter-based FACTS controllers”, IEEE Conference on Power System Technology, Vol. 1, Pg. 391 - 396, Dec. 2000. J.J. Paserba, “How FACTS controllers benefit AC transmission systems”, Power Engineering Society General Meeting, IEEE, Vol.2, June 2004, Pg. 1257 - 1262 N. Sahadat, et al., ''Power Quality Improvement of Large Power System Using a Conventional Method'', Engineering, Vol.3, No. 8, 2011, Pp. 823 828. doi: 10.4236/eng.2011.38100 P. Khan and H. Singh, " Power Flow Control in a Transmission Line Through UPFC", International Journal of Emerging Technology and Advanced Engineering, Vol. 2, Issue12, December 2012, www.ijetae.com S. Shankar and T. Ananthapadmanabha, "Identification of Unified Power Flow Controller Location Underline Outage Contingencies", International Conference on Advancements in Electronics and Power Engineering (ICAEPE' 2011) Bangkok Dec., 2011 ISSN: 2231-5381 http://www.ijettjournal.org Page 125

