Glaucoma Detection Using Optic Cup and Optic Disc Segmentation
advertisement
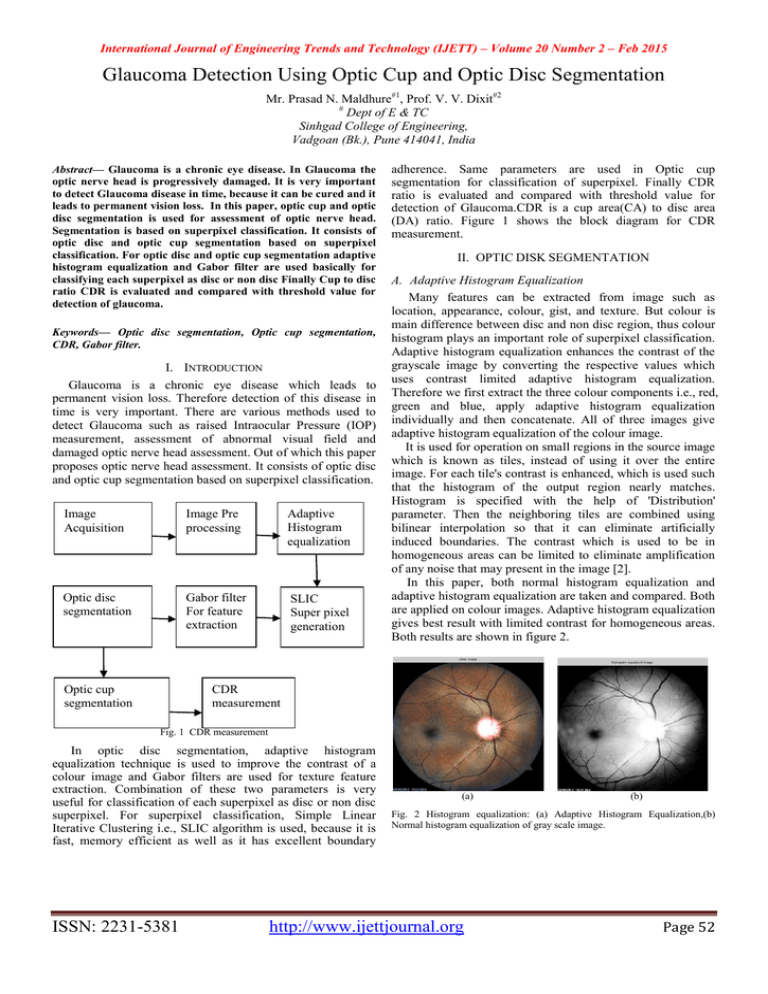
International Journal of Engineering Trends and Technology (IJETT) – Volume 20 Number 2 – Feb 2015 Glaucoma Detection Using Optic Cup and Optic Disc Segmentation Mr. Prasad N. Maldhure#1, Prof. V. V. Dixit#2 # Dept of E & TC Sinhgad College of Engineering, Vadgoan (Bk.), Pune 414041, India Abstract— Glaucoma is a chronic eye disease. In Glaucoma the optic nerve head is progressively damaged. It is very important to detect Glaucoma disease in time, because it can be cured and it leads to permanent vision loss. In this paper, optic cup and optic disc segmentation is used for assessment of optic nerve head. Segmentation is based on superpixel classification. It consists of optic disc and optic cup segmentation based on superpixel classification. For optic disc and optic cup segmentation adaptive histogram equalization and Gabor filter are used basically for classifying each superpixel as disc or non disc Finally Cup to disc ratio CDR is evaluated and compared with threshold value for detection of glaucoma. Keywords— Optic disc segmentation, Optic cup segmentation, CDR, Gabor filter. I. INTRODUCTION Glaucoma is a chronic eye disease which leads to permanent vision loss. Therefore detection of this disease in time is very important. There are various methods used to detect Glaucoma such as raised Intraocular Pressure (IOP) measurement, assessment of abnormal visual field and damaged optic nerve head assessment. Out of which this paper proposes optic nerve head assessment. It consists of optic disc and optic cup segmentation based on superpixel classification. Image Acquisition Image Pre processing Adaptive Histogram equalization Optic disc segmentation Gabor filter For feature extraction SLIC Super pixel generation Optic cup segmentation adherence. Same parameters are used in Optic cup segmentation for classification of superpixel. Finally CDR ratio is evaluated and compared with threshold value for detection of Glaucoma.CDR is a cup area(CA) to disc area (DA) ratio. Figure 1 shows the block diagram for CDR measurement. II. OPTIC DISK SEGMENTATION A. Adaptive Histogram Equalization Many features can be extracted from image such as location, appearance, colour, gist, and texture. But colour is main difference between disc and non disc region, thus colour histogram plays an important role of superpixel classification. Adaptive histogram equalization enhances the contrast of the grayscale image by converting the respective values which uses contrast limited adaptive histogram equalization. Therefore we first extract the three colour components i.e., red, green and blue, apply adaptive histogram equalization individually and then concatenate. All of three images give adaptive histogram equalization of the colour image. It is used for operation on small regions in the source image which is known as tiles, instead of using it over the entire image. For each tile's contrast is enhanced, which is used such that the histogram of the output region nearly matches. Histogram is specified with the help of 'Distribution' parameter. Then the neighboring tiles are combined using bilinear interpolation so that it can eliminate artificially induced boundaries. The contrast which is used to be in homogeneous areas can be limited to eliminate amplification of any noise that may present in the image [2]. In this paper, both normal histogram equalization and adaptive histogram equalization are taken and compared. Both are applied on colour images. Adaptive histogram equalization gives best result with limited contrast for homogeneous areas. Both results are shown in figure 2. CDR measurement Fig. 1 CDR measurement In optic disc segmentation, adaptive histogram equalization technique is used to improve the contrast of a colour image and Gabor filters are used for texture feature extraction. Combination of these two parameters is very useful for classification of each superpixel as disc or non disc superpixel. For superpixel classification, Simple Linear Iterative Clustering i.e., SLIC algorithm is used, because it is fast, memory efficient as well as it has excellent boundary ISSN: 2231-5381 (a) (b) Fig. 2 Histogram equalization: (a) Adaptive Histogram Equalization,(b) Normal histogram equalization of gray scale image. http://www.ijettjournal.org Page 52 International Journal of Engineering Trends and Technology (IJETT) – Volume 20 Number 2 – Feb 2015 B. SLIC: Superpixel Generation SLIC algorithm is used to aggregate nearby pixels into superpixels from retinal fundus images. It is simple to use and understand. SLIC is fast, memory efficient and having excellent boundary adherence. The algorithm uses the parameter g, which is the preferred number of nearly equallysized superpixels. In SLIC colour image is used in CIELAB colour space. Figure 3 shows the difference between RGB colour space and CIELAB colour space. (a) C. Feature Extraction Using Gabor filter For optic disc segmentation, the Peri-papillary atrophy PPA region is mystified as constituent of disc as it looks similar to the disc. It is essential to include feature extraction technique that reflects the deviation between the disc region and PPA region. Also the two distinct region superpixels appear similar apart from the texture. Thus, the superpixel does not work well with each of its histogram. (b) Fig. 3 Colour space: (a) CIELAB Colour space, (b) RGB colour space. The clustering procedure starts with an initialization step where g initial cluster centers Di = [lj aj bj xj yj] are sampled on a regular grid, spaced H pixels apart. To produce approximately equally sized superpixels, g initial cluster centers Dk are sampled on a regular grid space H = (N/g) ^ (1/2). The centers are then moved towards the seed locations which are comparable to the utmost gradient location in a 3* 3 neighbourhood. This is done so as to avoid centering of a superpixel on an edge [3]. In SLIC, the key to speed up our algorithm is limiting the size of the search region which minimizes the number of distance calculations; also it leads to improve the speed giving the advantage over conventional g- means clustering where each pixel has to be compared with all cluster centers. The approximate size H*H is the expected spatial extent of a superpixel in a region and 2H*2H is a search region for similar pixels around the superpixel centers [3]. Thus SLIC iteratively searches for its best matching pixel from the 2H*2H neighborhood around Dk and then computes the new cluster centers based on the found pixel. Finally, a postprocessing step enforces connectivity by re-assigning disjoint pixels to nearby superpixels. Cluster centers in RGB colour space and CIELIB colour space are shown in figure 4. Fig. 5 Challenge in Optic Disc segmentation: Disc and PPA region Gabor functions provide the optimal resolution for various wavelet bases in both the frequency and time (spatial) domains. While Gabor wavelet transform looks to be the optimal basis which is used to extract local features for several reasons. Moreover the trouble with disc and cup segmentation is that the bad or irregular visibility of boundary, because of blood vessels incoming into the disc region [6]. Gabor wavelets can be used for specific orientations and frequencies which is useful for difficulties with the blood vessels. Gabor wavelets act as low level oriented edge discriminator which also filters out the background noise of the source image. 2-D Gabor wavelet is the best option because of its directional selectiveness capability which is used for spotting oriented features and accurate tuning to specific frequencies [5]. Thus finally extracted disc for eye ball fundus image is as shown in figure 6. (a) (b) Fig. 6 Extracted disc: (a) Cross section of optic nerve, (b) Extracted optic disc (a) (b) Fig. 4 Cluster centers: (a) RGB colour space image with cluster centers (b) CELIB colour space image with cluster centers ISSN: 2231-5381 http://www.ijettjournal.org Page 53 International Journal of Engineering Trends and Technology (IJETT) – Volume 20 Number 2 – Feb 2015 III. OPTIC CUP SEGMENTATION For optic cup segmentation, thresholding and binarization can be used. Using this method, the given image will convert to the threshold or binarized image. From such binarized image we can easily extract optic cup boundary. Segmentation is the process in which, each pixel in the source image is assigned to two or more classes. Two or more classes usually result in several binary images. In binarization, depending upon the mean value of the entire pixel, each pixel in an image is assigned the value as „1‟or „0‟. If it is greater than the mean value then it is '1' else it is '0'.From a grayscale image, thresholding process is used to create binary images. In this process, if pixel value is greater than some threshold value then that particular pixel in an image is marked as "object" pixels or else it will be considered as "background" pixels [8]. Typically, an object pixel is assigned a value of “1” whereas a background pixel is assigned a value of “0.” Finally, depending on a pixel's label, a binary image is formed by colouring each pixel with white or black colour [4]. (a) REFERENCES [1] H. A. Quigley and A. T. Broman, “The number of people with glaucoma worldwide in 2010 and 2020,” Br. J. Ophthalmol., vol. 90, no. 3, pp. 262–267, 2006. [2] S. Y. Shen, T.Y.Wong, P. J. Foster, J. L. Loo,M.Rosman, S.C. Loon, W. L. Wong, S. M. Saw, and T. Aung, “The prevalence and types of glaucoma in malay people: The singapore malay eye study,” Invest. [3] Ophthalmol. Vis. Sci., vol. 49, no. 9, pp. 3846–3851, 2008. [4] P. J. Foster, F. T. Oen, D. Machin, T. P. Ng, J. G. Devereux, G. J. Johnson, P. T. Khaw, and S. K. Seah, “The prevalence of glaucoma in Chinese residents of Singapore: A cross-sectional population survey of the Tanjong Pagar district,” Arch. Ophthalmol., vol. 118, no. 8, pp. 1105–1111, 2000. [5] Centre Eye Res. Australia, Tunnel vision: The economic impact of primary open angle glaucoma 2008 [Online]. Available: http://nla.gov.au/ nla.arc-86954 [6] G. D. Joshi, J. Sivaswamy, and S. R. Krishnadas, “Optic disc and cup segmentation from monocular colour retinal images for glaucoma assessment,” IEEE Trans. Med. Imag., vol. 30, no. 6, pp. 1192–1205, Jun. 2011. [7] J. Xu, O. Chutatape, E. Sung, C. Zheng, and P. C. T. Kuan, “Optic disc feature extraction via modified deformable model technique for glaucoma analysis,” Pattern Recognit., vol. 40, pp. 2063–2076, 2007. [8] M. D. Abràmoff, W. L. M. Alward, E. C. Greenlee, L. Shuba, C. Y. Kim, J. H. Fingert, and Y. H. Kwon, “Automated segmentation of theoptic disc from stereo colour photographs using physiologically plausible features,” Invest. Ophthalmol. Vis. Sci., vol. 48, pp. 1665– 1673, 2007. [9] Z. Hu,M. D. Abràmoff, Y. H. Kwon, K. Lee, andM. K. Garvin, “Automated segmentation of neural canal opening and optic cup in 3-d spectral optical coherence tomography volumes of the optic nerve head,”Invest. Ophthalmol. Vis. Sci., vol. 51, pp. 5708–5717, 2010. (b) Fig. 5 Extracted cup: (a) Edge map subtracted image, (b) Extracted optic cup. Selection of the threshold value plays an important role in the thresholding process. There are different methods used to select a threshold value such as, 1) automatic thresholding, in which a thresholding algorithm is used to compute a threshold value automatically, 2) users can manually select a threshold value. The most promising method would be to choose the median or mean value. The reason behind that is if the object pixels are relatively more brighter than the background pixel, then these object pixel must also be brighter than the average pixels. Since the cup and disc boundary which is detected from segmentation method can be affected by large number of blood vessels, it may not stand for the real shape of the cup and disc. Therefore the morphological operations are used to reshape the obtained cup and disc boundary. Finally Cup to Disc ratio is evaluated by taking the ratio of the area of cup to area of disc [6]. IV. CDR CALCULATION After extracting Optic disc and Optic cup, the CDR ratio is calculated, this is given by ratio of area of optic cup to Optic disc. When computed CDR is larger than threshold value, it will be detected as glaucoma, otherwise healthy. ISSN: 2231-5381 V. DISCUSSION AND CONCLUSION This paper presented Superpixel sorting based methods for cup and disc segmentation. It has been proved that Gabor filter for feature extraction is beneficial for both optic disc and optic cup segmentation. Adaptive histogram equalization plays an important role as it gives us best colour contrast image. For Superpixel generation, SLIC algorithm gives best result with improved performance and reduced computations. For classification of superpixels as disc or non disc region, use of Gabor filter for feature extraction is very beneficial. Adaptive histogram equalization with Gabor filter are also important while classification of superpixel, to extract optic cup. Finally we compute CDR ratio for detection of Glaucoma. [10] M.D.Abràmoff, K. Lee, M. Niemeijer,W. L.M.Alward, E. Greenlee, M. Garvin, M. Sonka, and Y. H. Kwon, “Automated segmentation of the cup and rim from spectral domain oct of the optic nerve head,” Invest. Ophthalmol. Vis. Sci., vol. 50, pp. 5778–5784, 2009. [11] N. Inoue, K. Yanashima, K. Magatani, and T. Kurihara, “Development of a simple diagnostic method for the glaucoma using ocular fundus pictures,” in Int. Conf. IEEE Eng. Med. Biol. Soc., 2005, pp. 3355–3358. http://www.ijettjournal.org Page 54 International Journal of Engineering Trends and Technology (IJETT) – Volume 20 Number 2 – Feb 2015 [12] X. Zhu and R. M. Rangayyan, “Detection of the optic disc in images of the retina using the hough transform,” in Int. Conf. IEEE Eng. Med. Biol. Soc., 2008, pp. 3546–3549. [13] A. Aquino, M. Gegundez-Arias, and D. Marin, “Detecting the optic disc boundary in digital fundus images using morphological, edge detection, and feature extraction techniques,” IEEE Trans. Med. Imag.,vol. 29, no. 11, pp. 1860–1869, Nov. 2010. [14] J. Cheng, J. Liu, D. W. K. Wong, F. Yin, C. Cheung, M. Baskaran, T. Aung, and T. Y. Wong, “Automatic optic disc segmentation with peripapillary atrophy elimination,” in Int. Conf. IEEE Eng. in Med. Biol. Soc., 2011, pp. 6624–6627. [15] J. Lowell, A. Hunter, D. Steel, A. Basu, R. Ryder, E. Fletcher, and L. Kennedy, “Optic nerve head segmentation,” IEEE Trans. Med. Imag., vol. 23, no. 2, pp. 256–264, Feb. 2004. [16] F. Yin, J. Liu, S. H. Ong, Y. Sun, D. W. K. Wong, N. M. Tan, C. Cheung, M. Baskaran, T. Aung, and T. Y. Wong, “Model-based optic nerve head segmentation on retinal fundus images,” in Int. Conf. IEEE Eng. Med. Biol. Soc., 2011, pp. 2626–2629. [17] D. W. K. Wong, J. Liu, N. M. Tan, F. Yin, B. H. Lee, and T. Y. Wong, “Learning-based approach for the automatic detection of the optic disc in digital retinal fundus photographs,” in Int. Conf. IEEE Eng. Med. Biol. Soc., 2010, pp. 5355–5358. [18] T. Cour, F. Benezit, and J. Shi, “Spectral segmentation with multiscale graph decomposition,” in Proc. IEEE Conf. Comput. Vis. Pattern Recognit., 2005, vol. 2, pp. 1124–1131. [19] A. Moore, S. Prince, J. Warrell, U. Mohammed, and G. Jones, “Superpixel lattices,” in Proc. IEEE Conf. Comput. Vis. Pattern Recognit.,2008, pp. 1–8. [20] R. Achanta, A. Shaji, K. Smith, A. Lucchi, P. Fua, and S. Susstrunk, “Slic superpixels compared to state-of-the-art superpixel methods,” IEEE Trans. Pattern Anal. Mach. Intell., vol. 34, no. 11, pp. 2274–2281, Nov. 2012. [21] C. C. Chang and C. J. Lin, LIBSVM: A library for support vector machines 2001 [Online]. Available: http://www.csie.ntu.edu.tw/~cjlin/ libsvm [22] G. D. Joshi, J. Sivaswamy, K. Karan, and R. Krishnadas, “Optic disc and cup boundary detection using regional information,” in Proc. IEEE Int. Symp. Biomed. Imag., 2010, pp. 948–951. [23] D.W. K.Wong, J. Liu, J. H. Lim, H. Li, and T. Y. Wong, “Automated detection of kinks from blood vessels for optic cup segmentation in retinal images,” in Proc. SPIE, 2009, p. 72601J. [24] A. Fitzgibbon, M. Pilu, and R. B. Fisher, “Direct least squares fitting of ellipses,” IEEE Trans. Pattern Anal. Mach. Intell., vol. 21, no. 5, pp. 476–480, May 1999. [25] Z. Zhang, F. Yin, J. Liu, W. K. Wong, N. M. Tan, B. H. Lee, J. Cheng, and T. Y. Wong, “Origa-light:An online retinal fundus image database for glaucoma analysis and research,” in Int. Conf. IEEE Eng. Med. Biol. Soc., 2010, pp. 3065–3068.465–479, Mar. 2012. ISSN: 2231-5381 http://www.ijettjournal.org Page 55
