Intensified Arabian Sea tropical storms
advertisement
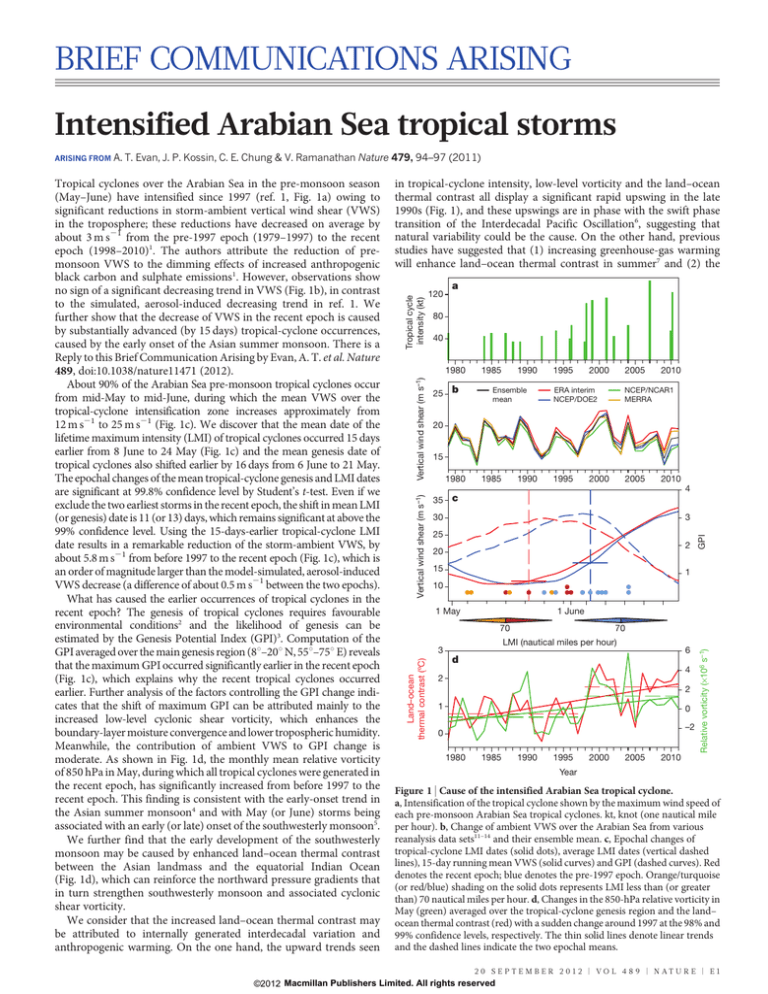
BRIEF COMMUNICATIONS ARISING Intensified Arabian Sea tropical storms A. T. Evan, J. P. Kossin, C. E. Chung & V. Ramanathan Nature 479, 94–97 (2011) 120 a 80 40 25 b 1985 1990 Ensemble mean 1995 2000 2005 2010 ERA interim NCEP/DOE2 NCEP/NCAR1 MERRA 1995 2005 20 15 1980 1985 1990 2000 2010 4 35 c 3 30 25 2 20 15 GPI Vertical wind shear (m s–1) 1980 1 10 1 May 1 June 70 3 70 LMI (nautical miles per hour) 6 d 4 2 2 1 0 –2 0 1980 1985 1990 1995 2000 2005 Relative vorticity (×106 s–1) Tropical cycle intensity (kt) in tropical-cyclone intensity, low-level vorticity and the land–ocean thermal contrast all display a significant rapid upswing in the late 1990s (Fig. 1), and these upswings are in phase with the swift phase transition of the Interdecadal Pacific Oscillation6, suggesting that natural variability could be the cause. On the other hand, previous studies have suggested that (1) increasing greenhouse-gas warming will enhance land–ocean thermal contrast in summer7 and (2) the Vertical wind shear (m s–1) Tropical cyclones over the Arabian Sea in the pre-monsoon season (May–June) have intensified since 1997 (ref. 1, Fig. 1a) owing to significant reductions in storm-ambient vertical wind shear (VWS) in the troposphere; these reductions have decreased on average by about 3 m s21 from the pre-1997 epoch (1979–1997) to the recent epoch (1998–2010)1. The authors attribute the reduction of premonsoon VWS to the dimming effects of increased anthropogenic black carbon and sulphate emissions1. However, observations show no sign of a significant decreasing trend in VWS (Fig. 1b), in contrast to the simulated, aerosol-induced decreasing trend in ref. 1. We further show that the decrease of VWS in the recent epoch is caused by substantially advanced (by 15 days) tropical-cyclone occurrences, caused by the early onset of the Asian summer monsoon. There is a Reply to this Brief Communication Arising by Evan, A. T. et al. Nature 489, doi:10.1038/nature11471 (2012). About 90% of the Arabian Sea pre-monsoon tropical cyclones occur from mid-May to mid-June, during which the mean VWS over the tropical-cyclone intensification zone increases approximately from 12 m s21 to 25 m s21 (Fig. 1c). We discover that the mean date of the lifetime maximum intensity (LMI) of tropical cyclones occurred 15 days earlier from 8 June to 24 May (Fig. 1c) and the mean genesis date of tropical cyclones also shifted earlier by 16 days from 6 June to 21 May. The epochal changes of the mean tropical-cyclone genesis and LMI dates are significant at 99.8% confidence level by Student’s t-test. Even if we exclude the two earliest storms in the recent epoch, the shift in mean LMI (or genesis) date is 11 (or 13) days, which remains significant at above the 99% confidence level. Using the 15-days-earlier tropical-cyclone LMI date results in a remarkable reduction of the storm-ambient VWS, by about 5.8 m s21 from before 1997 to the recent epoch (Fig. 1c), which is an order of magnitude larger than the model-simulated, aerosol-induced VWS decrease (a difference of about 0.5 m s21 between the two epochs). What has caused the earlier occurrences of tropical cyclones in the recent epoch? The genesis of tropical cyclones requires favourable environmental conditions2 and the likelihood of genesis can be estimated by the Genesis Potential Index (GPI)3. Computation of the GPI averaged over the main genesis region (8u–20u N, 55u–75u E) reveals that the maximum GPI occurred significantly earlier in the recent epoch (Fig. 1c), which explains why the recent tropical cyclones occurred earlier. Further analysis of the factors controlling the GPI change indicates that the shift of maximum GPI can be attributed mainly to the increased low-level cyclonic shear vorticity, which enhances the boundary-layer moisture convergence and lower tropospheric humidity. Meanwhile, the contribution of ambient VWS to GPI change is moderate. As shown in Fig. 1d, the monthly mean relative vorticity of 850 hPa in May, during which all tropical cyclones were generated in the recent epoch, has significantly increased from before 1997 to the recent epoch. This finding is consistent with the early-onset trend in the Asian summer monsoon4 and with May (or June) storms being associated with an early (or late) onset of the southwesterly monsoon5. We further find that the early development of the southwesterly monsoon may be caused by enhanced land–ocean thermal contrast between the Asian landmass and the equatorial Indian Ocean (Fig. 1d), which can reinforce the northward pressure gradients that in turn strengthen southwesterly monsoon and associated cyclonic shear vorticity. We consider that the increased land–ocean thermal contrast may be attributed to internally generated interdecadal variation and anthropogenic warming. On the one hand, the upward trends seen Land–ocean thermal contrast (ºC) ARISING FROM 2010 Year Figure 1 | Cause of the intensified Arabian Sea tropical cyclone. a, Intensification of the tropical cyclone shown by the maximum wind speed of each pre-monsoon Arabian Sea tropical cyclones. kt, knot (one nautical mile per hour). b, Change of ambient VWS over the Arabian Sea from various reanalysis data sets11–14 and their ensemble mean. c, Epochal changes of tropical-cyclone LMI dates (solid dots), average LMI dates (vertical dashed lines), 15-day running mean VWS (solid curves) and GPI (dashed curves). Red denotes the recent epoch; blue denotes the pre-1997 epoch. Orange/turquoise (or red/blue) shading on the solid dots represents LMI less than (or greater than) 70 nautical miles per hour. d, Changes in the 850-hPa relative vorticity in May (green) averaged over the tropical-cyclone genesis region and the land– ocean thermal contrast (red) with a sudden change around 1997 at the 98% and 99% confidence levels, respectively. The thin solid lines denote linear trends and the dashed lines indicate the two epochal means. 2 0 S E P T E M B E R 2 0 1 2 | VO L 4 8 9 | N AT U R E | E 1 ©2012 Macmillan Publishers Limited. All rights reserved BRIEF COMMUNICATIONS ARISING increasing loading of desert dust and soot aerosol over northern India and the foothills of the Himalayas during the pre-monsoon season may enhance tropospheric warming and strengthen land–ocean thermal contrast by absorbing solar radiation8,9. Further studies are needed to clarify the causes and the complexity of the interaction between aerosols, the monsoon and tropical cyclones. 2. Methods 6. Tropical-cyclone data are from the International Best Track Archive for Climate Stewardship (IBTrACS) data10. On the basis of the ERA interim11, NCEP/ NCAR112, NCEP/DOE213, and MERRA14 reanalysis data sets, the VWS of 850– 200 hPa is averaged over the tropical-cyclone intensification zone (10u–22u N, 55u–75u E). The GPI is averaged over the tropical-cyclone genesis region (8u–20u N, 55u–75u E). The land–ocean thermal contrast is defined by the 2-m air temperature difference between the Asian continent (20u–35u N, 40u–80u E) and the equatorial Indian Ocean (10u S–10u N, 40u–80u E). The significance of sudden changes was established using the Le Page test15. 3. 4. 5. 7. 8. 9. 10. Gray, W. M. Global view of the origin of tropical disturbances and storms. Mon. Weath. Rev. 96, 669–700 (1968). Emanuel, K. A. & Nolan, D. S. Tropical cyclones and the global climate system. In 26th Conf. on Hurricanes and Tropical Meteorology 240–241 (American Meteorological Society, 2004). Kajikawa, Y., Yasunari, T., Yoshida, S. & Fujiyama, H. Advanced Asian summer monsoon onset in recent decades. Geophys. Res. Lett. 39, L03803 (2012). Evan, A. T. & Camargo, S. J. A climatology of Arabian Sea cyclonic storms. J. Clim. 24, 140–158 (2011). Wang, B., Liu, J., Kim, H. J., Webster, P. J. & Yim, S. Y. Recent change of the global monsoon precipitation (1979–2008). Clim. Dyn. doi:10.1007/s00382–011– 1266-z (2012). Meehl, G. A. et al. in Climate Change 2007: The Physical Science Basis. Contribution of Working Group I to the Fourth Assessment Report of the Intergovernmental Panel on Climate Change (eds Solomon, S. et al.) Ch. 10 (Cambridge University Press, 2007). Lau, K.-M. & Kim, K.-M. Observational relationships between aerosol and Asian monsoon rainfall, and circulation. Geophys. Res. Lett. 33, L21810 (2006). Meehl, G., Arblaster, J. & Collins, W. Effects of black carbon aerosols on the Indian monsoon. J. Clim. 21, 2869–2882 (2008). Knapp, K. R., Kruk, M. C., Levinson, D. H., Diamond, H. J. & Neumann, C. J. The International Best Track Archive for Climate Stewardship (IBTrACS): unifying tropical cyclone data. Bull. Am. Meteorol. Soc. 91, 363–376 (2010). Dee, D. P. et al. The ERA-interim reanalysis: configuration and performance of the data assimilation system. Q. J. R. Meteorol. Soc. 137, 553–597 (2011). Kalnay, E. et al. The NCEP/NCAR 40-year reanalysis project. Bull. Am. Meteorol. Soc. 77, 437–471 (1996). Kanamitsu, M. et al. NCEP-DOE AMIP-II reanalysis (R-2). Bull. Am. Meteorol. Soc. 83, 1631–1643 (2002). Rienecker, M. M. et al. MERRA—NASA’s Modern-Era Retrospective Analysis for Research and Applications. J. Clim. 24, 3624–3648 (2011). Lepage, Y. A table for a combined Wilcoxon Ansari-Bradley statistic. Biometrika 60, 113–116 (1973). Bin Wang1,2, Shibin Xu1,3 & Liguang Wu2 1 Department of Meteorology and International Pacific Research Center, University of Hawaii at Manoa, Honolulu, Hawaii 96822, USA. 2 Key Laboratory of Meteorological Disaster of Ministry of Education, Nanjing University of Information Science and Technology, Nanjing, 210044, China. email: wangbin@hawaii.edu 3 Physical Oceanography Laboratory, Ocean University of China, Qingdao, 266100, China. 13. Received 24 April; accepted 13 July 2012. Author Contributions B.W. planned and finalized the manuscript. L.W. drafted the manuscript, S.X. did data analysis and plotting. 1. Competing Financial Interests Declared none. Evan, A. T., Kossin, J. P., Chung, C. E. & Ramanathan, V. Arabian Sea tropical cyclones intensified by emissions of black carbon and other aerosols. Nature 479, 94–97 (2011). 11. 12. 14. 15. doi:10.1038/nature11470 Evan et al. reply REPLYING TO B. Wang, S. Xu & L. Wu Nature 489, http://dx.doi.org/10.1038/nature11470 (2012) Arabian Sea tropical cyclones have become stronger over the past 30 years owing to a reduction in vertical wind shear (VWS) brought about by radiative forcing from pollution aerosols1. Wang et al.2 argue that the decline in VWS results from a systematic shift in storm genesis date, which may be part of a natural cycle or another consequence of regional pollution. However, their conclusions2, although interesting, are not supported by our analysis and are probably sensitive to biases in the observational record. Wang et al.2 concluded that there are no linear trends in premonsoon VWS observable from reanalysis when averaged over the Arabian Sea. From analyses of three independent reanalysis data sets we showed1 that there are downward trends in VWS over the northeastern region of the Arabian Sea, where most storms form and track. We did not claim that there existed basin-averaged downward trends in VWS. Wang et al.2 claim that the strong intensification of tropical cyclones is due to an advancement in their genesis or LMI date. Although the Julian date on which pre-monsoon storms reached their lifetime maximum intensity (LMI) has advanced by 15.6 days, of the five strongest storms forming in the basin (LMI . 50 m s21) three had LMI dates greater than the climatological mean (Fig. 1a). There is no statistically significant difference in the mean LMI date (P-value 5 0.66) or genesis date (P-value 5 0.51) when comparing the strongest storms (LMI . 50 m s21) to all others, which is evidence that the weak VWS experienced by the strongest storms is not due to an advancement in genesis or LMI date. Another flaw in the theory of ref. 2 is their implicit assumption that Arabian Sea tropical cyclones experience the basin-averaged VWS. For example, they2 used the annual cycle of VWS averaged over the Arabian Sea to show that a systematic change in genesis date is responsible for the decrease in VWS experienced by Arabian Sea storms in the second half of the 1979–2010 record. However, tropical cyclones are influenced only by the VWS in the environment surrounding the storm, or the storm-ambient VWS. To test the hypothesis of ref. 2 we calculated the storm-ambient VWS from reanalysis data3, and then for reanalysis VWS fields consisting of only linear trends in VWS (which indicates the influence of Table 1 | Change in storm-ambient VWS between 1979-–1996 and 1997-–2010 Storm-ambient VWS difference Reanalysis Trends Genesis Median Mean 23.1 23.5 21.7 23.2 24.0 23.4 P value 0.01/0.01 0.01/0.02 0.06/0.10 The changes due to trends in the reanalysis VWS (Trends), and due to changes in the genesis date (Genesis) in the median/mean pre-monsoon Arabian Sea tropical-cyclone storm-ambient VWS from the first (1979–1996) to the second (1997–2010) half of the tropical cyclone record in the reanalysis (AMIP3) are shown. The P-values indicate the statistical significance of the separation of the median/ mean as determined by a Wilcoxon rank sum/t-means test. E 2 | N AT U R E | VO L 4 8 9 | 2 0 S E P T E M B E R 2 0 1 2 ©2012 Macmillan Publishers Limited. All rights reserved BRIEF COMMUNICATIONS ARISING b Storm-ambient VWS (m s–1) a 80 LMI (m s–1) 60 40 20 15 10 5 20 Reanalysis 10 97 –2 0 96 19 79 –1 9 10 Trends 19 97 –2 0 96 19 19 79 –1 9 –2 0 97 19 79 –1 9 96 170 19 140 150 160 Julian day 10 0 130 Genesis Figure 1 | Arabian Sea cyclone LMI dates and influence of trends and genesis date on storm-ambient VWS. a, The Arabian Sea pre-monsoon cyclone LMI is plotted as a function of the Julian date on which LMI occurred. Blue triangles indicate storms in 1979–1997; red triangles indicate storms in 1998–2010. The solid vertical line is the mean LMI date for the storms with LMI , 50 m s21; the dashed vertical line is the mean LMI date for the storms with LMI . 50 m s21. b, Box plots of storm-ambient VWS from reanalysis VWS (Reanalysis), from only the trends in reanalysis VWS (Trends), and from only the annual cycle in reanalysis VWS (Genesis) are shown. Plotted are the median (red line), the inner quartile range (blue box), and the 25th (or 75th) percentile minus (or plus) 1.5 times the inner quartile range (horizontal black line), with the grey shaded region indicating the change in storm-ambient VWS from the Reanalysis case for reference. The significance (P-value) of the separation of the median and mean values in each distribution is given in Table 1. To facilitate comparison we added an offset value to the storm-ambient VWS data from the trend and annual cycle cases (in b) so that the median storm-ambient VWS in each was equivalent to that from the Reanalysis case. VWS trends on changes in storm-ambient VWS) or only the annual cycle of VWS (which indicates the influence of tropical-cyclone genesis date on changes in storm-ambient VWS) (see Methods). A comparison of the periods 1979–1996 and 1997–2010 shows that the median storm-ambient VWS changed by 23.1 m s21 (Fig. 1b)1. We find a change of 23.5 m s21 in the median storm-ambient VWS from linear trends in the reanalysis VWS, and a change of 21.9 m s21 from earlier tropical cyclone genesis dates. Therefore, the background linear trends in VWS are large enough to account for the noted change in storm-ambient VWS, but the change in storm genesis date can account for only about half of the observed reduction in stormambient VWS. Furthermore, there is no statistically significant (P-value , 0.05) change in the mean or median of the distribution of storm-ambient VWS owing to earlier genesis date (Table 1). We further note that the tendency for earlier genesis over the past 30 years is probably due in part to technological improvements. Before 1998 the Arabian Sea was observed at the edge of the viewing area of the existing geostationary satellites, but in 1998 the repositioning of a satellite over the Indian Ocean improved the angle at which storms in the basin could be viewed. This improvement in the observations probably increased the ability to detect and track weak storms4, contributing to the increase in tropical cyclogenesis date shown in ref. 2. Finally, there are a number of studies confirming the influence of pollution aerosols on the characteristics of the Southeast Asia monsoon5–8, supporting our findings that these pollution aerosols are potentially the fundamental cause of the uptick in Arabian Sea cyclone intensity1. estimated by removing the annual cycle and interannual variability (or interannual variability and linear trends) from the reanalysis data, retaining only the linear trends (or annual cycle) in the pre-monsoon VWS fields. In the genesis case, and as in ref. 2, we calculated the storm-ambient VWS for tropical cyclones forming before (or on or after) 1997 using the annual cycle of VWS calculated from 1979–1996 (or 1997–2010). Amato T. Evan1,2, James P. Kossin3,4, Chul ‘Eddy’ Chung5 & V. Ramanathan2 1 University of Virginia, Charlottesville, Virginia 22904, USA. email: aevan@ucsd.edu 2 Scripps Institution of Oceanography, San Diego, California 92093, USA. 3 NOAA’s National Climatic Data Center, Asheville, North Carolina 28801, USA. 4 NOAA Cooperative Institute for Meteorological Satellite Studies, Madison, Wisconsin 53706, USA. 5 Gwangju Institute of Science and Technology, Gwangju 500712, South Korea. 1. 2. 3. 4. 5. 6. Methods 7. Tropical cyclogenesis is defined as the time at which a tropical storm acquired a sustained wind speed of 17 m s21, and LMI date is the time at which the storm first reached its maximum sustained wind speed, based on data from the International Best Track Archive for Climate Stewardship9. We calculated the storm-ambient VWS from reanalysis3 in a manner consistent with ref. 1. The influence of linear trends (or genesis date) on the storm-ambient VWS was 8. 9. Evan, A. T., Kossin, J. P., Chung, C. E. & Ramanathan, V. Arabian Sea tropical cyclones intensified by emissions of black carbon and other aerosols. Nature 479, 94–97 (2011). Wang, B., Xu, S. & Wu, L. Intensified Arabian Sea tropical storms. Nature 489, http://dx.doi.org/10.1038/nature11470 (2012). Kanamitsu, M. et al. NCEP-DOE AMIP-II Reanalysis (R-2). Bull. Am. Meteorol. Soc. 83, 1631–1643 (2002). Evan, A. T. & Camargo, S. J. A climatology of Arabian Sea cyclonic storms. J. Clim. 24, 140–158 (2011). Chung, C. E. & Ramanathan, V. Weakening of North Indian SST gradients and the monsoon rainfall in India and the Sahel. J. Clim. 19, 2036–2045 (2006). Lau, K.-M. et al. The joint aerosol-monsoon experiment. Bull. Am. Meteorol. Soc. 89, 369–383 (2008). Meehl, G., Arblaster, J. & Collins, W. Effects of black carbon aerosols on the Indian monsoon. J. Clim. 21, 2869–2882 (2008). Ramanathan, V. et al. Atmospheric brown clouds: impacts on South Asian climate and hydrological cycle. Proc. Natl Acad. Sci. USA 102, 5326–5333 (2005). Knapp, K. P., Kruk, M. C., Levinson, D. H., Diamond, H. J. & Neumann, C. J. The International Best Track Archive for Climate Stewardship (IBTrACS): unifying tropical cyclone data. Bull. Am. Meteorol. Soc. 91, 363–376 (2010). doi:10.1038/nature11471 2 0 S E P T E M B E R 2 0 1 2 | VO L 4 8 9 | N AT U R E | E 3 ©2012 Macmillan Publishers Limited. All rights reserved
