An Alignment-free Method for Detection of Functional Conservation of Regulatory Sequences
advertisement
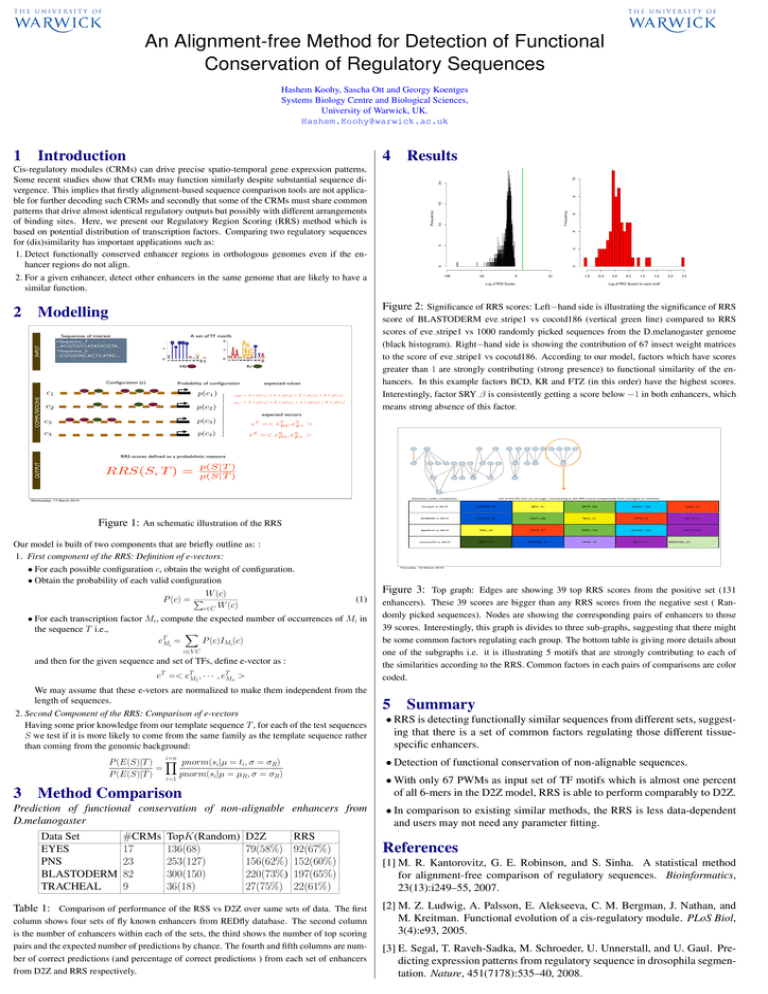
An Alignment-free Method for Detection of Functional Conservation of Regulatory Sequences Hashem Koohy, Sascha Ott and Georgy Koentges Systems Biology Centre and Biological Sciences, University of Warwick, UK. Hashem.Koohy@warwick.ac.uk 1 Introduction 4 Results Cis-regulatory modules (CRMs) can drive precise spatio-temporal gene expression patterns. Some recent studies show that CRMs may function similarly despite substantial sequence divergence. This implies that firstly alignment-based sequence comparison tools are not applicable for further decoding such CRMs and secondly that some of the CRMs must share common patterns that drive almost identical regulatory outputs but possibly with different arrangements of binding sites. Here, we present our Regulatory Region Scoring (RRS) method which is based on potential distribution of transcription factors. Comparing two regulatory sequences for (dis)similarity has important applications such as: 1. Detect functionally conserved enhancer regions in orthologous genomes even if the enhancer regions do not align. 2. For a given enhancer, detect other enhancers in the same genome that are likely to have a similar function. Modelling Sequences of interest >Sequence_T ...ACGTGTCATATACGTA... >Sequence_S ...CGGGTACACTCATAC... INPUT 2 Figure 2: Significance of RRS scores: Left−hand side is illustrating the significance of RRS A set of TF motifs Hb Configuration (c) COMPUTATIONS score of BLASTODERM eve stripe1 vs cocotd186 (vertical green line) compared to RRS scores of eve stripe1 vs 1000 randomly picked sequences from the D.melanogaster genome (black histogram). Right−hand side is showing the contribution of 67 insect weight matrices to the score of eve stripe1 vs cocotd186. According to our model, factors which have scores greater than 1 are strongly contributing (strong presence) to functional similarity of the enhancers. In this example factors BCD, KR and FTZ (in this order) have the highest scores. Interestingly, factor SRY β is consistently getting a score below −1 in both enhancers, which means strong absence of this factor. Kr Probability of configuration c1 p(c1 ) c2 p(c2 ) c3 p(c3 ) c4 p(c4 ) expected values eHb = 3 × p(c1 ) + 1 × p(c2 ) + 3 × p(c3 ) + 0 × p(c4 ) eKr = 2 × p(c1 ) + 2 × p(c2 ) + 1 × p(c3 ) + 0 × p(c4 ) expected vectors T eT =< eT Hb , eKr > S eS =< eS Hb , eKr > hstripe3ET38Nfree prdzebraenhancerNfree Ubxabx17EYENfree hstripe0Nfree betaTub60Dbeta314vm1PNSNfree evestripe2Nfree prdOENfree soso10EYENfree btdSsBgNfree runstripe17Nfree salmsalmTSETRACHEALNfree hstripe5Nfree dppdlmelNfree AbdBIAB5Nfree clusterat55CCE8016Nfree OUTPUT RRS scores defined as a probabilistic measure RRS(S, T ) = tllD32Nfree p(S|T ) p(S|T̄ ) zen07Nfree chnSOPPNSNfree atoREPNSNfree m4HZm4PNSNfree rhoMLElongTRACHEALNfree SerV19EYENfree HLHmbetaenhancerPNSNfree EsplPNCPNSNfree tldpromoterfusionrightNfree ftzzebraelementNfree Poxn9PNSNfree Obp56hpromPNSNfree salmsal242SPNfree slp1slpBNfree evestripe1Nfree tllK10Nfree ocotd186Nfree HLHmgammaHZmgammaKXEYENfree Enhancers under comparison Wednesday, 17 March 2010 Figure 1: An schematic illustration of the RRS Our model is built of two components that are briefly outline as: : 1. First component of the RRS: Definition of e-vectors: • For each possible configuration c, obtain the weight of configuration. • Obtain the probability of each valid configuration W (c) P (c) = P c∈C W (c) (1) and then for the given sequence and set of TFs, define e-vector as : eT =< eTM1 , · · · , eTMn > We may assume that these e-vetors are normalized to make them independent from the length of sequences. 2. Second Component of the RRS: Comparison of e-vectors Having some prior knowledge from our template sequence T , for each of the test sequences S we test if it is more likely to come from the same family as the template sequence rather than coming from the genomic background: i=n Prediction of functional conservation of non-alignable enhancers from D.melanogaster D2Z 79(58%) 156(62%) 220(73%) 27(75%) I$KR_Q6 I$ADF1_Q6 I$SN_01 AbdBIAB vs tllk10 I$ABDB_01 I$KR_Q6 I$DL_01 I$SN_01 I$FTZ_01 dppdlmel vs tllk10 I$DL_01 I$SN_01 I$KR_Q6 I$ADF1_Q6 I$FTZ_01 clusterat55 vs tllk10 I$KR_01 I$ABDB_01 I$SN_02 I$FTZ_01 I$BRCZ3_01 enhancers). These 39 scores are bigger than any RRS scores from the negative sest ( Randomly picked sequences). Nodes are showing the corresponding pairs of enhancers to those 39 scores. Interestingly, this graph is divides to three sub-graphs, suggesting that there might be some common factors regulating each group. The bottom table is giving more details about one of the subgraphs i.e. it is illustrating 5 motifs that are strongly contributing to each of the similarities according to the RRS. Common factors in each pairs of comparisons are color coded. 5 Summary • RRS is detecting functionally similar sequences from different sets, suggesting that there is a set of common factors regulating those different tissuespecific enhancers. • With only 67 PWMs as input set of TF motifs which is almost one percent of all 6-mers in the D2Z model, RRS is able to perform comparably to D2Z. Method Comparison TopK(Random) 136(68) 253(127) 300(150) 36(18) I$DL_01 • Detection of functional conservation of non-alignable sequences. P (E(S)|T ) Y pnorm(si|µ = ti, σ = σR) = P (E(S)|T̄ ) i=1 pnorm(si|µ = µR, σ = σR) #CRMs 17 23 82 9 I$ABDB_01 Figure 3: Top graph: Edges are showing 39 top RRS scores from the positive set (131 c∈V C Data Set EYES PNS BLASTODERM TRACHEAL hstripe5 vs tllk10 Thursday, 18 March 2010 • For each transcription factor Mi, compute the expected number of occurrences of Mi in the sequence T i.e., X T eMi = P (c)IMi (c) 3 List of five TFs that are strongly contributing to the RRS scores (respectively from strongest to weakest) RRS 92(67%) 152(60%) 197(65%) 22(61%) Table 1: Comparison of performance of the RSS vs D2Z over same sets of data. The first column shows four sets of fly known enhancers from REDfly database. The second column is the number of enhancers within each of the sets, the third shows the number of top scoring pairs and the expected number of predictions by chance. The fourth and fifth columns are number of correct predictions (and percentage of correct predictions ) from each set of enhancers from D2Z and RRS respectively. • In comparison to existing similar methods, the RRS is less data-dependent and users may not need any parameter fitting. References [1] M. R. Kantorovitz, G. E. Robinson, and S. Sinha. A statistical method for alignment-free comparison of regulatory sequences. Bioinformatics, 23(13):i249–55, 2007. [2] M. Z. Ludwig, A. Palsson, E. Alekseeva, C. M. Bergman, J. Nathan, and M. Kreitman. Functional evolution of a cis-regulatory module. PLoS Biol, 3(4):e93, 2005. [3] E. Segal, T. Raveh-Sadka, M. Schroeder, U. Unnerstall, and U. Gaul. Predicting expression patterns from regulatory sequence in drosophila segmentation. Nature, 451(7178):535–40, 2008.
