Prospective power estimation for peak inference with the toolbox neuropower.
advertisement

Prospective power estimation for peak
inference with the toolbox neuropower.
1
2
1
1
Seurinck ,
3
Joke Durnez , Gregory Burgess , Jasper Degryse , Ruth
2
1
Deanna Barch , Beatrijs Moerkerke , Thomas E. Nichols
1
Ghent University, Ghent, Belgium. 2Washington University Medical School, St. Louis, MO.
3
University of Warwick, Coventry, United Kingdom.
Power estimation procedure
0.2
0.3
0.4
0.5
3
4
5
0.5
1
1.5
2
true
estimated
25
1.0
6
HCP task
3
4
5
EMOTION
GAMBLING
LANGUAGE
MOTOR
RELATIONAL
SOCIAL
WM
2
Different symbols refer
to different contrasts
0.2
0.4
0.6
0.8
1.0
2
28
RESULT:
voxelwise activation map
active
non-active
COMBINE RESULTS
For large effect sizes we accurate estimate power
curves.
https://neuropower.shinyapps.io/neuropower
Department of Data analysis - H. Dunantlaan 1 - 9000 Gent
4
5
6
True expected effect size
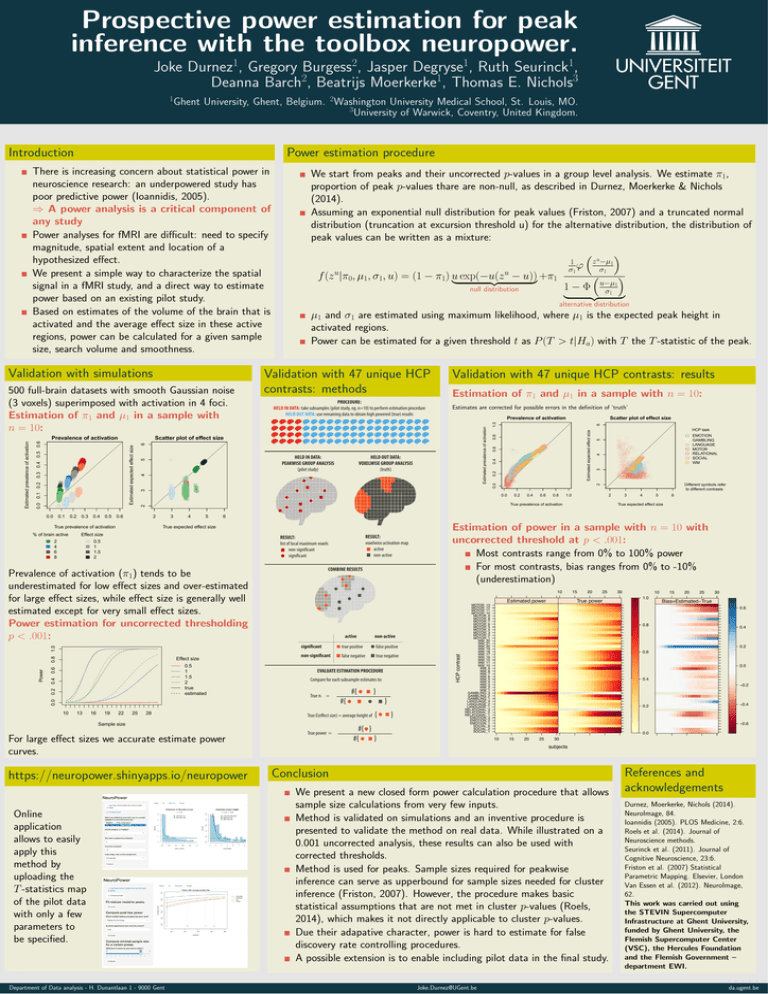
Estimation of power in a sample with n = 10 with
uncorrected threshold at p < .001:
Most contrasts range from 0% to 100% power
For most contrasts, bias ranges from 0% to -10%
(underestimation)
10
active
non-active
significant
true positive
false positive
non-significant
false negative
true negative
EVALUATE ESTIMATION PROCEDURE
Compare for each subsample estimates to:
True π1 =
#{
True power =
}
#{
}
True E(effect size) = average height of
Sample size
Online
application
allows to easily
apply this
method by
uploading the
T -statistics map
of the pilot data
with only a few
parameters to
be specified.
3
6
True expected effect size
22
Scatter plot of effect size
Estimated expected effect size
6
5
4
2
0.0 0.2 0.4 0.6 0.8 1.0
Power
Prevalence of activation
HELD OUT DATA:
VOXELWISE GROUP ANALYSIS
(truth)
RESULT:
list of local maximum voxels
non-significant
significant
19
Estimates are corrected for possible errors in the definition of ‘truth’
3
0.6
Effect size
16
Estimation of π1 and µ1 in a sample with n = 10:
0.8
PROCEDURE:
HELD IN DATA: take subsamples (pilot study, eg. n=10) to perform estimation procedure
HELD OUT DATA: use remaining data to obtain high powered (true) results
Validation with 47 unique HCP contrasts: results
0.6
Validation with 47 unique HCP
contrasts: methods
Prevalence of activation (π1) tends to be
underestimated for low effect sizes and over-estimated
for large effect sizes, while effect size is generally well
estimated except for very small effect sizes.
Power estimation for uncorrected thresholding
p < .001:
13
}
True prevalence of activation
0.5
1
1.5
2
10
1−Φ
{z
|
u−µ1
σ1
µ1 and σ1 are estimated using maximum likelihood, where µ1 is the expected peak height in
activated regions.
Power can be estimated for a given threshold t as P (T > t|Ha) with T the T -statistic of the peak.
0.0
Effect size
2
4
6
8
z u−µ1
σ1
alternative distribution
HELD IN DATA:
PEAKWISE GROUP ANALYSIS
(pilot study)
True prevalence of activation
% of brain active
null distribution
{
#{ }
#{
}
}
HCP contrast
0.1
f (z |π0, µ1, σ1, u) = (1 − π1) u
exp(−u(z
−
u))
+π
|
{z
} 1
2
Estimated expected effect size
0.0
u
Scatter plot of effect size
0.0 0.1 0.2 0.3 0.4 0.5 0.6
Estimated prevalence of activation
Prevalence of activation
1
σ1 ϕ
0.4
500 full-brain datasets with smooth Gaussian noise
(3 voxels) superimposed with activation in 4 foci.
Estimation of π1 and µ1 in a sample with
n = 10:
u
Estimated prevalence of activation
Validation with simulations
We start from peaks and their uncorrected p-values in a group level analysis. We estimate π1,
proportion of peak p-values thare are non-null, as described in Durnez, Moerkerke & Nichols
(2014).
Assuming an exponential null distribution for peak values (Friston, 2007) and a truncated normal
distribution (truncation at excursion threshold u) for the alternative distribution, the distribution of
peak values can be written as a mixture:
0.2
There is increasing concern about statistical power in
neuroscience research: an underpowered study has
poor predictive power (Ioannidis, 2005).
⇒ A power analysis is a critical component of
any study
Power analyses for fMRI are difficult: need to specify
magnitude, spatial extent and location of a
hypothesized effect.
We present a simple way to characterize the spatial
signal in a fMRI study, and a direct way to estimate
power based on an existing pilot study.
Based on estimates of the volume of the brain that is
activated and the average effect size in these active
regions, power can be calculated for a given sample
size, search volume and smoothness.
0.0
Introduction
Estimated power
MOTOR_13
MOTOR_12
MOTOR_11
MOTOR_10
MOTOR_9
MOTOR_8
MOTOR_7
MOTOR_6
MOTOR_5
MOTOR_4
MOTOR_3
MOTOR_2
MOTOR_1
WM_22
WM_21
WM_20
WM_19
WM_18
WM_17
WM_16
WM_15
WM_11
WM_10
WM_9
WM_8
WM_7
WM_6
WM_5
WM_4
WM_3
WM_2
WM_1
GAMBLING_3
GAMBLING_2
GAMBLING_1
LANGUAGE_4
LANGUAGE_2
LANGUAGE_1
RELATIONAL_3
RELATIONAL_2
RELATIONAL_1
EMOTION_3
EMOTION_2
EMOTION_1
SOCIAL_6
SOCIAL_2
SOCIAL_1
15
20
25
True power
30
1.0
10
15
20
25
30
Bias=Estimated−True
0.8
0.6
0.6
0.4
0.2
0.0
0.4
0.2
−0.2
−0.4
−0.6
10
15
20
25
30
0.0
subjects
Conclusion
We present a new closed form power calculation procedure that allows
sample size calculations from very few inputs.
Method is validated on simulations and an inventive procedure is
presented to validate the method on real data. While illustrated on a
0.001 uncorrected analysis, these results can also be used with
corrected thresholds.
Method is used for peaks. Sample sizes required for peakwise
inference can serve as upperbound for sample sizes needed for cluster
inference (Friston, 2007). However, the procedure makes basic
statistical assumptions that are not met in cluster p-values (Roels,
2014), which makes it not directly applicable to cluster p-values.
Due their adapative character, power is hard to estimate for false
discovery rate controlling procedures.
A possible extension is to enable including pilot data in the final study.
Joke.Durnez@UGent.be
References and
acknowledgements
Durnez, Moerkerke, Nichols (2014).
NeuroImage, 84.
Ioannidis (2005). PLOS Medicine, 2:6.
Roels et al. (2014). Journal of
Neuroscience methods.
Seurinck et al. (2011). Journal of
Cognitive Neuroscience, 23:6.
Friston et al. (2007) Statistical
Parametric Mapping. Elsevier, London
Van Essen et al. (2012). NeuroImage,
62.
This work was carried out using
the STEVIN Supercomputer
Infrastructure at Ghent University,
funded by Ghent University, the
Flemish Supercomputer Center
(VSC), the Hercules Foundation
and the Flemish Government –
department EWI.
da.ugent.be


