CAESAR: A Technique for Angle-Dispersive Powder Diffraction Using an Energy-
advertisement

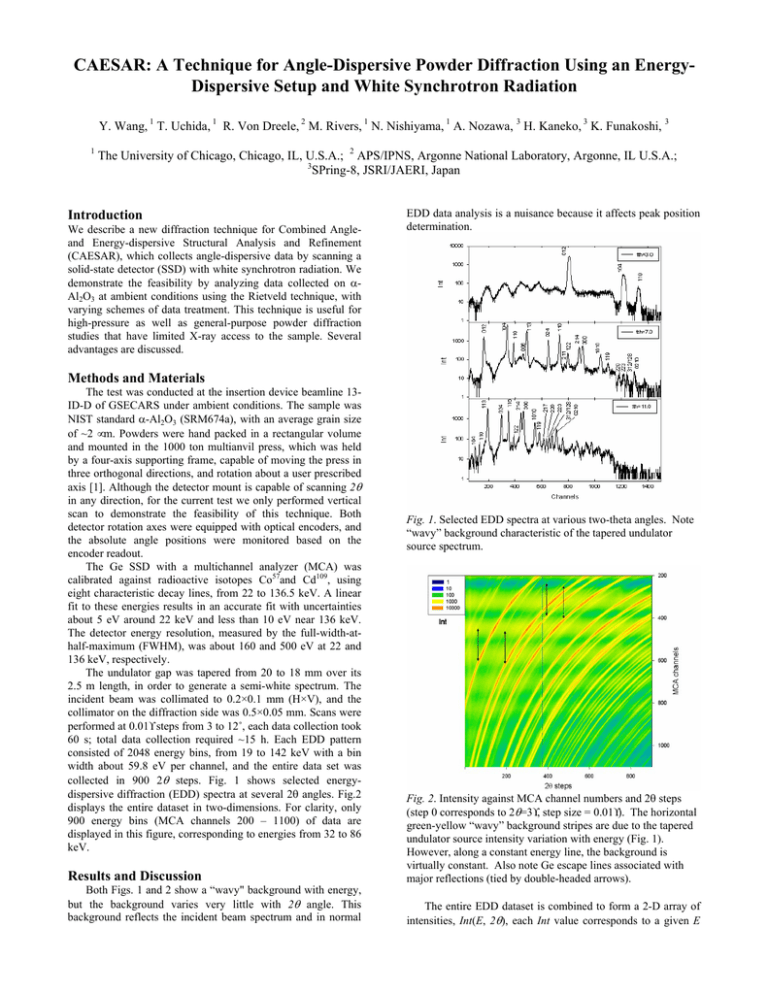
CAESAR: A Technique for Angle-Dispersive Powder Diffraction Using an EnergyDispersive Setup and White Synchrotron Radiation Y. Wang, 1 T. Uchida, 1 R. Von Dreele, 2 M. Rivers, 1 N. Nishiyama, 1 A. Nozawa, 3 H. Kaneko, 3 K. Funakoshi, 3 1 The University of Chicago, Chicago, IL, U.S.A.; 2 APS/IPNS, Argonne National Laboratory, Argonne, IL U.S.A.; 3 SPring-8, JSRI/JAERI, Japan Introduction We describe a new diffraction technique for Combined Angleand Energy-dispersive Structural Analysis and Refinement (CAESAR), which collects angle-dispersive data by scanning a solid-state detector (SSD) with white synchrotron radiation. We demonstrate the feasibility by analyzing data collected on αAl2O3 at ambient conditions using the Rietveld technique, with varying schemes of data treatment. This technique is useful for high-pressure as well as general-purpose powder diffraction studies that have limited X-ray access to the sample. Several advantages are discussed. EDD data analysis is a nuisance because it affects peak position determination. Methods and Materials The test was conducted at the insertion device beamline 13ID-D of GSECARS under ambient conditions. The sample was NIST standard α-Al2O3 (SRM674a), with an average grain size of ~2 µm. Powders were hand packed in a rectangular volume and mounted in the 1000 ton multianvil press, which was held by a four-axis supporting frame, capable of moving the press in three orthogonal directions, and rotation about a user prescribed axis [1]. Although the detector mount is capable of scanning 2θ in any direction, for the current test we only performed vertical scan to demonstrate the feasibility of this technique. Both detector rotation axes were equipped with optical encoders, and the absolute angle positions were monitored based on the encoder readout. The Ge SSD with a multichannel analyzer (MCA) was calibrated against radioactive isotopes Co57and Cd109, using eight characteristic decay lines, from 22 to 136.5 keV. A linear fit to these energies results in an accurate fit with uncertainties about 5 eV around 22 keV and less than 10 eV near 136 keV. The detector energy resolution, measured by the full-width-athalf-maximum (FWHM), was about 160 and 500 eV at 22 and 136 keV, respectively. The undulator gap was tapered from 20 to 18 mm over its 2.5 m length, in order to generate a semi-white spectrum. The incident beam was collimated to 0.2×0.1 mm (H×V), and the collimator on the diffraction side was 0.5×0.05 mm. Scans were performed at 0.01° steps from 3 to 12˚, each data collection took 60 s; total data collection required ~15 h. Each EDD pattern consisted of 2048 energy bins, from 19 to 142 keV with a bin width about 59.8 eV per channel, and the entire data set was collected in 900 2θ steps. Fig. 1 shows selected energydispersive diffraction (EDD) spectra at several 2θ angles. Fig.2 displays the entire dataset in two-dimensions. For clarity, only 900 energy bins (MCA channels 200 – 1100) of data are displayed in this figure, corresponding to energies from 32 to 86 keV. Results and Discussion Both Figs. 1 and 2 show a “wavy" background with energy, but the background varies very little with 2θ angle. This background reflects the incident beam spectrum and in normal Fig. 1. Selected EDD spectra at various two-theta angles. Note “wavy” background characteristic of the tapered undulator source spectrum. Fig. 2. Intensity against MCA channel numbers and 2θ steps (step 0 corresponds to 2θ=3°, step size = 0.01°). The horizontal green-yellow “wavy” background stripes are due to the tapered undulator source intensity variation with energy (Fig. 1). However, along a constant energy line, the background is virtually constant. Also note Ge escape lines associated with major reflections (tied by double-headed arrows). The entire EDD dataset is combined to form a 2-D array of intensities, Int(E, 2θ), each Int value corresponds to a given E (photon energy) and 2θ index (Fig. 1). Subsets of the 2-D dataset can be selected according to a fixed E or 2θ value, corresponding to angle-dispersive diffraction (ADD) or EDD spectra, respectively. By choosing the intensities at various 2θ values for certain fixed energies (wavelengths), a series of ADD patterns, Int(E=const., 2θ), are obtained. These data are fit using the Rietveld refinement software package GSAS [2,]. Fig. 3 shows the results from an analysis by fitting a spectrum with a photon energy of 67.30 keV (MCA channel 800), corresponding to a wavelength of 0.1842 Å. The residuals Rp and wRp for the fit are 0.164 and 0.189, respectively (see [2] for residual definition). data in this energy range in each EDD spectrum and we use only 40 data points at a 5-channel increment for this demonstration. Table 1. Rietveld refinement results of a combined fit to data at 3 wavelengths. The refined atomic positions are: Al (0, 0, 0.35(1)) and O (0.30(1), 0, ¼), with a = 4.7667(2) Å, c = 13.0127(9) Å. For comparison, the NIST parameters are Al (0, 0, 0.35216(1)), O (0.30624(4), 0, ¼), a = 4.7602(4) Å, and c = 12.993(2) Å [3]. Variation in the scaling factor represents relative source spectrum intensity variation as a function of energy and SSD sensitivity to photons at higher energies. Wavelength, Å 0.202097 0.157045 0.116565 Overall Fig. 3. An example of a Rietveld refinement on a single wavelength (0.1842 Å) spectrum. Data obtained from MCA channel 850. In this and all of the following fits, the observed intensities were corrected for the volume of crystallites that were present in a diffraction volume at a given 2θ. Because an SSD can record data from a wide range of photon energies simultaneously, a multiple of wavelengths are available for structural refinement with a better coverage in Q. This is particularly beneficial for studies where X-ray access is limited. Data from various wavelengths can be analyzed simultaneously using GSAS. Angular dependence of the absorption is not significant, because of the small 2θ range and relatively high energies used. Table 1 gives the quantitative fitting results and the values for alumina given by [3]. The dense redundant data coverage allows coarser step scans while still maintaining reasonable density of coverage in 2θ, because data in adjacent energy channels can be binned to enhance data density. According to the Bragg’s law, for a given d value, the angular difference ∆θ observed at two photon energies (or wavelengths) is related by the following equation: ∆θ = tanθ ∆λ/λ (1) where ∆λ is the difference between the two wavelengths. We use (1) to convert observed intensities at various energies to a specific wavelength. For a coarse step size corresponding to ∆θ/θ = 0.01-0.1 (e.g., scans from 1 to 10˚ with a step size of 0.1˚), we need to combine an energy range corresponding to a total wavelength span of ∆λ/λ = ∆Ε/Ε = 0.1 to ensure enough angular coverage density and resolution for structural refinement. To demonstrate this, we select a subgroup of the EDD spectra collected at 3.0°, 3.1°, 3.2°, 3.3°…, and 12.0°, to simulate a scan with a scan at a 0.1° step size. We chose an energy range of 73.94 to 81.57 keV, centered at 77.75 keV, corresponding to a ∆Ε/Ε ≈ ±0.05. There are 200 channels of Energy, keV 61.3469 78.4956 106.3610 Scaling factor 0.7139 0.1913 0.0275 wRp Rp 0.233 0.286 0.382 0.266 0.169 0.182 0.272 0.189 Fig. 4 depicts impact of energy binning on peak-width by comparing data from a single-energy spectrum at 77.75 keV, with binned profiles. Compared to a single monochromatic 2θ scan at 0.01˚ step size, the binned data density in 2θ is increased by a factor of 10, despite a coarser step size of 0.1˚. Even when the step size is increased to 0.2˚, a reasonable angular data density can still be achieved by binning data with the wider energy range of ∆Ε/Ε ≈ ±0.10, although variations in background become more important. No significant increase in peak width is observed, suggesting that we have not compromised resolution in 2θ. Fig. 4. A comparison of peak width of a single energy spectrum (0.01˚ step size) at 77.75 keV (solid circles) with the same peak after binning 40 channel data that are within ±5% of this photon energy, with a step size of 0.1˚ (open circles), and binning 80 channel data within ±10% of this energy, with a step size of 0.2˚ (crosses). The binned data have a denser angle coverage, with no significant increase in peak width. For comparison, a singleenergy (77.65 keV), 0.1˚ step scan has only a three points in this 2θ range across the peak (large open triangles). The binned data are interpolated into equal 2θ steps for Rietveld refinement. Fig. 5 shows the fit with wRp = 0.12. Thus a reasonable structural refinement can be obtained using 0.1˚ or even 0.2˚ step sizes. For a 50 s EDD data collection, approximately 40 min would be required for a complete 2θ scan from 3 to 12˚ with a step size of 0.2°. This collection time was based on <5 % dead time and over 1000 counts/channel for the average peak intensity. With properly configured electronics and stronger incident beam, it is possible to reduce this time by a factor of 5 - 10, making it feasible to collect monochromatic data within 10 min. Fig. 6 compares fitted peak widths, expressed as FWHM, as a function of 2θ, between a single-wavelength ADD (E = 77.75 keV) and the binned ADD. The FWHM values are calculated based on [4]: FWHM = U tan2θ + V tanθ +W, (2) Both the Gaussian (U, V, W) and Lorentzian components are refined in our GSAS analysis, but only the Gaussian widths are plotted in Fig.6, since they are considered to represent instrument characteristics. Lorentzian components, which reflect particle size and microstrain, do not contribute significantly to the instrumental FWHM. These Gaussian FWHM values obtained from the binned and single channel datasets are virtually identical, varying almost linearly from ~0.025° at 2θ =3° to ~0.065° at 2θ=11°. Fig. 6. FWHM of diffraction peaks (in °) as a function of 2θ . Dotted line is from fitting data at a single wavelength (E=77.65 keV), solid line from binned data using 40 different photon energies from 73.94 to 81.56 keV. Long-dashed line represents predicted angular resolution limit due to energy resolution of the solid state detector, based on FWHM measurements on characteristic radioactive decay lines, based on (3). A detailed report based on this development has been published [5]. Applications of this technique to high-pressure high temperature experimentation in the multianvil press have been initiated [6]. Acknowledgments Fig. 5. Rietveld refinement of a simulated 0.1° step scan, after binning the data from 73.94 to 81.56 keV, centered at 77.75 keV (0.1595Å). A total of 41 channels are used, corresponding to MCA channels from 1873 to 2068, at a 5 channel increment. The wRp value is 0.12. The detector resolution was determined based on the FWHM of two characteristic isotope decay lines at 5.9 keV (Fe55) and 122.06 keV (Co57 γ2). Calibrations show that energy resolution varies from 140 eV at 5.9 keV to 490 eV at 122.06 keV, corresponding to ∆E/E of 0.0237 and 0.0040, respectively. Assuming that ∆E/E varies with square root of E, at 77.65 keV the resolution ∆E/E is about 0.005. Further assuming that this ∆E/E represents the energy discrimination in the CAESAR technique, from Eq (2), the width of a given diffraction peak (FWHM expressed in 2×∆θ) is related to ∆E/E by: 2×∆θ = 2×(180/π) tanθ ∆Ε/Ε (3) The long-dashed line in Fig. 6 shows that the predicted peak width based on (3) is consistent with the angular dependence observed in the sample FWHM, which is about 25% worse than the detector energy resolution (without considering effects of beam collimating optics), or about 0.006 at 77.65 keV. This resolution is comparable to modern laboratory sources and hence can used used for reasonable structural refinement. We thank N. Lazarz, F. Sopron, M. Jagger (GSECARS), and W. Utsumi (JAERI) for their support during the development of this technique, and an anonymous reviewer for constructive comments. GSECARS is supported by the National Science Foundation - Earth Sciences, Department of Energy Geosciences, W. M. Keck Foundation, and the U.S. Department of Agriculture. Use of the Advanced Photon Source was supported by the U.S. Department of Energy, Basic Energy Sciences, Office of Science, under Contract No. W-31-109-Eng38. Work supported by the NSF grant EAR001188. References [1] Y. Wang, M. Rivers, T. Uchida, P. Murray, G. Shen, S. Sutton, J. Chen, Y. Xu, D. Weidner, Proceedings of the International Conference on High Pressure Science and Technology (AIRAPT-17), Science and Technology of High Pressure, vol. 2, pp. 1047-1052 (2000). [2] A.C. Larson, R.B. Von Dreele, R.B. Los Alamos National Laboratory Report LAUR 86-748 (2000). [3] M. Oetzel, G. Heger, J. Appl. Cryst., 32, 799-807 (1999). [4] G. Caglioti, A. Paoletti, F.P. Ricci, Nucl. Instrum. Methods, 35, 223228 (1958). [5] Y. Wang, T. Uchida, R. Von Dreele, M. Rivers, N. Nishiyama, K. Funakoshi, A. Nozawa, H. Kaneko J. Appl. Cryst., (2004) [6] Y. Wang, T. Uchida, R. Von Dreele, A. Nozawa, K. Funakoshi, N. Nishiyama, H. Kaneko, in: Frontiers in High Pressure Research: Geophysical Applications, eds. J. Chen, Y. Wang, T. Duffy, G. Shen, L. Dobrzhinetskaya, in press.


