Capacity Utilization in Manufacturing
advertisement

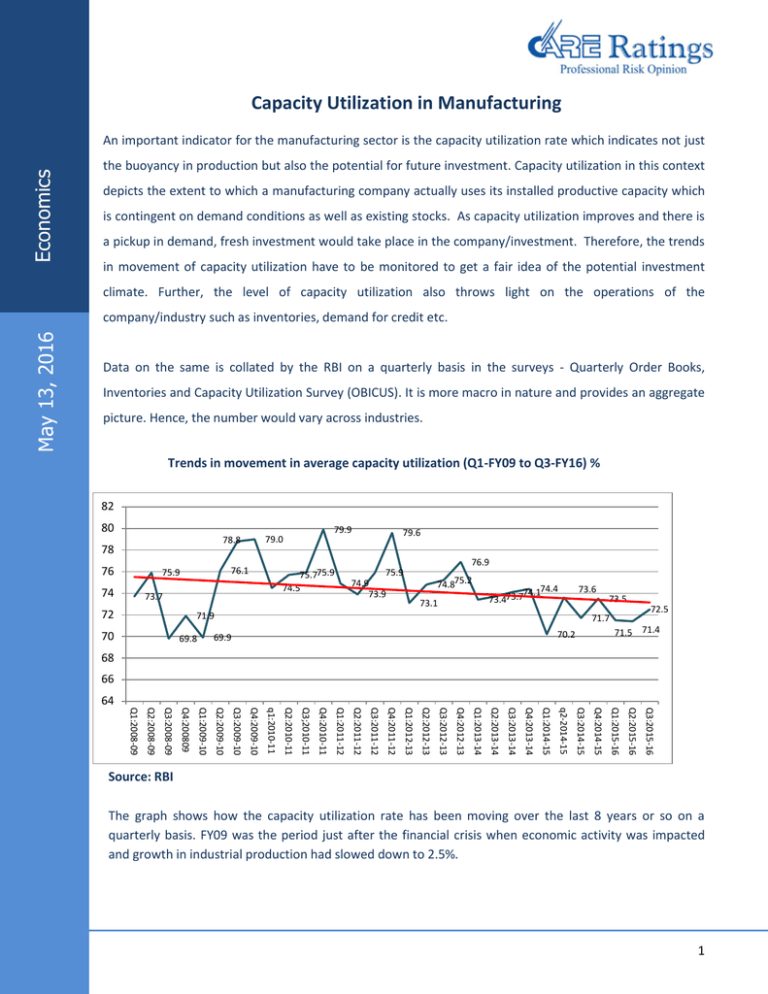
Capacity Utilization in Manufacturing Economics An important indicator for the manufacturing sector is the capacity utilization rate which indicates not just the buoyancy in production but also the potential for future investment. Capacity utilization in this context depicts the extent to which a manufacturing company actually uses its installed productive capacity which is contingent on demand conditions as well as existing stocks. As capacity utilization improves and there is a pickup in demand, fresh investment would take place in the company/investment. Therefore, the trends in movement of capacity utilization have to be monitored to get a fair idea of the potential investment climate. Further, the level of capacity utilization also throws light on the operations of the May 13, 2016 company/industry such as inventories, demand for credit etc. Data on the same is collated by the RBI on a quarterly basis in the surveys - Quarterly Order Books, Inventories and Capacity Utilization Survey (OBICUS). It is more macro in nature and provides an aggregate picture. Hence, the number would vary across industries. Trends in movement in average capacity utilization (Q1-FY09 to Q3-FY16) % 82 80 78 76 74 75.775.9 74.5 73.7 72 79.6 76.9 76.1 75.9 79.9 79.0 78.8 75.9 74.9 73.9 74.875.2 73.1 74.174.4 73.473.7 73.6 71.9 69.8 69.9 Q4:200809 Q2:2009-10 70 73.5 72.5 71.7 71.5 71.4 70.2 68 66 Q3:2015-16 Q2:2015-16 Q1:2015-16 Q4:2014-15 Q3:2014-15 q2-2014-15 Q1:2014-15 Q4:2013-14 Q3:2013-14 Q2:2013-14 Q1:2013-14 Q4:2012-13 Q3:2012-13 Q2:2012-13 Q1:2012-13 Q4:2011-12 Q3:2011-12 Q2:2011-12 Q1:2011-12 Q4:2010-11 Q3;2010-11 Q2:2010-11 q1:2010-11 Q4:2009-10 Q3:2009-10 Q1:2009-10 Q3:2008-09 Q2:2008-09 Q1:2008-09 64 Source: RBI The graph shows how the capacity utilization rate has been moving over the last 8 years or so on a quarterly basis. FY09 was the period just after the financial crisis when economic activity was impacted and growth in industrial production had slowed down to 2.5%. 1 Economics There was improvement in the subsequent two years with manufacturing growth peaking in 2010-11. This was also the time that the capacity utilization rate had increased to almost 80%, which is the highest rate that has been witnessed during this period. Interest rates were also low at this time and the RBI increased the repo rate in the latter part of 2010-11. The subsequent increase in rates in FY12 which moderated subsequently, combined with low industrial growth led to the capacity utilization rate remaining low. An interesting feature that stands out here is that the utilization rate tends to increase in the fourth quarter of the year as this is the time when companies increase their output to ostensibly meet their annual targets. However since 2011-12, these peaks have also come down to 76.9% in 2012-13, 74.4% in 2013-14 and 73.6% in 2014-15. Relation with growth To understand the relation between manufacturing growth and capacity utilization a regression equation has been drawn up for this period linking capacity utilization with change in manufacturing growth, which in turn has been reckoned on a m-o-m basis. It is taken on m-o-m basis, as changes over the previous month should have a bearing on utilization rates and not the y-o-y growth rate. R-square 0.319429 Intercept 74.2 Coefficient 0.2818 t-ratio 3.68934 The relationship is also fairly strong with almost a third of the variation in capacity utilization rate being explained by changes in the manufacturing growth rate. The coefficient too is significant at the 5% level. The coefficient of correlation between the two variables works out to 0.56 which is significant. Concluding remarks The trend line which has been fitted in the graph does indicate a downward movement almost unequivocally which is a concern from the investment viewpoint. Future decisions on investment will be contingent on the utilization levels as well as demand conditions and interest rates on the supply side. As long as production growth levels are low, there would be a tendency for utilization levels to also be subdued which will come in the way of future investment. As has been observed in the past, utilization rates have touched the 80% mark when industrial growth rate was relatively high in the 8-9% range. Presently with growth being in the region of 3-4%, the existing capacity would probably still be able to meet the incremental demand. The growth path in manufacturing would determine hence to a large extent the utilization rate which in turn will drive investment objectives. Capacity utilization in manufacturing Economics Contact: Madan Sabnavis Chief Economist madan.sabnavis@careratings.com 91-022-67543489 Anushka Sawarkar Associate Economist Anushka.sawarkar@careratings.com 91-022-61443609 Disclaimer This report is prepared by Credit Analysis & Research Limited (CARE Ratings). CARE Ratings has taken utmost care to ensure accuracy and objectivity while developing this report based on information available in public domain. However, neither the accuracy nor completeness of information contained in this report is guaranteed. CARE Ratings is not responsible for any errors or omissions in analysis/inferences/views or for results obtained from the use of information contained in this report and especially states that CARE Ratings has no financial liability whatsoever to the user of this report. Capacity utilization in manufacturing


