Economic Impact of Localizing Detroit’s Food System By Michael H. Shuman
advertisement

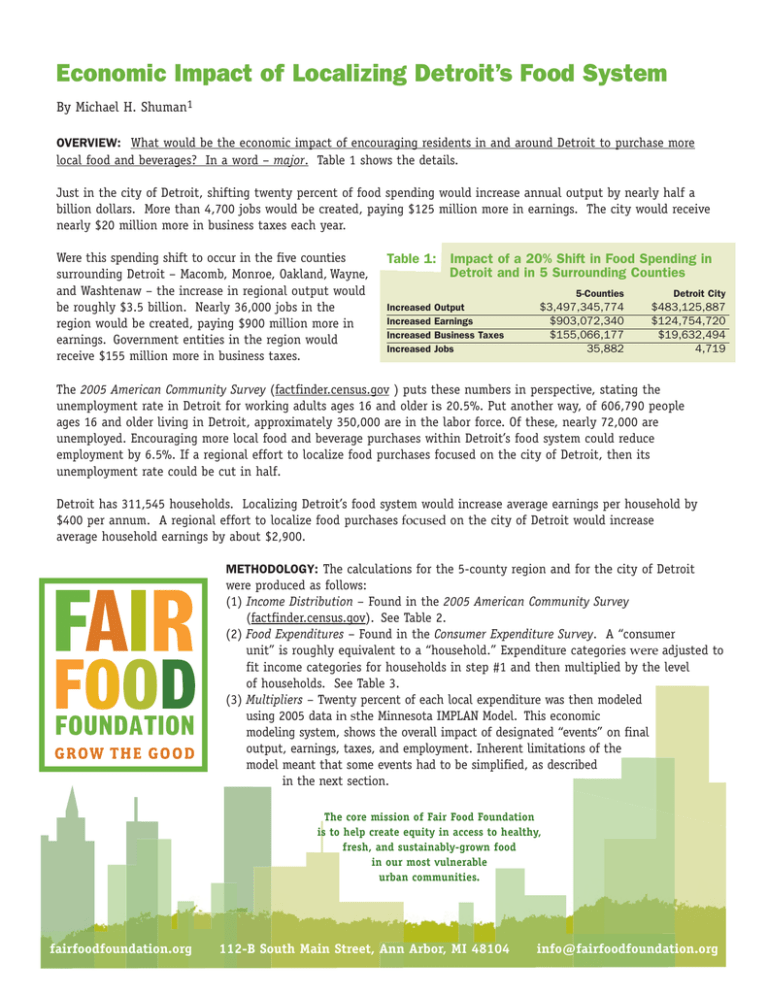
Economic Impact of Localizing Detroit’s Food System By Michael H. Shuman1 OVERVIEW: What would be the economic impact of encouraging residents in and around Detroit to purchase more local food and beverages? In a word – major. Table 1 shows the details. Just in the city of Detroit, shifting twenty percent of food spending would increase annual output by nearly half a billion dollars. More than 4,700 jobs would be created, paying $125 million more in earnings. The city would receive nearly $20 million more in business taxes each year. Were this spending shift to occur in the five counties surrounding Detroit – Macomb, Monroe, Oakland, Wayne, and Washtenaw – the increase in regional output would be roughly $3.5 billion. Nearly 36,000 jobs in the region would be created, paying $900 million more in earnings. Government entities in the region would receive $155 million more in business taxes. Table 1: Impact of a 20% Shift in Food Spending in Detroit and in 5 Surrounding Counties Increased Increased Increased Increased Output Earnings Business Taxes Jobs 5-Counties Detroit City $3,497,345,774 $903,072,340 $155,066,177 35,882 $483,125,887 $124,754,720 $19,632,494 4,719 The 2005 American Community Survey (factfinder.census.gov ) puts these numbers in perspective, stating the unemployment rate in Detroit for working adults ages 16 and older is 20.5%. Put another way, of 606,790 people ages 16 and older living in Detroit, approximately 350,000 are in the labor force. Of these, nearly 72,000 are unemployed. Encouraging more local food and beverage purchases within Detroit’s food system could reduce employment by 6.5%. If a regional effort to localize food purchases focused on the city of Detroit, then its unemployment rate could be cut in half. Detroit has 311,545 households. Localizing Detroit’s food system would increase average earnings per household by $400 per annum. A regional effort to localize food purchases focused on the city of Detroit would increase average household earnings by about $2,900. METHODOLOGY: The calculations for the 5-county region and for the city of Detroit were produced as follows: (1) Income Distribution – Found in the 2005 American Community Survey (factfinder.census.gov). See Table 2. (2) Food Expenditures – Found in the Consumer Expenditure Survey. A “consumer unit” is roughly equivalent to a “household.” Expenditure categories were adjusted to fit income categories for households in step #1 and then multiplied by the level of households. See Table 3. (3) Multipliers – Twenty percent of each local expenditure was then modeled using 2005 data in sthe Minnesota IMPLAN Model. This economic modeling system, shows the overall impact of designated “events” on final output, earnings, taxes, and employment. Inherent limitations of the model meant that some events had to be simplified, as described in the next section. The core mission of Fair Food Foundation is to help create equity in access to healthy, fresh, and sustainably-grown food in our most vulnerable urban communities. fairfoodfoundation.org 112-B South Main Street, Ann Arbor, MI 48104 info@fairfoodfoundation.org Table 2: Income Distribution for Households Macomb Monroe Oakland Washtenaw Wayne TOTAL Detroit Less than $10,000 20,301 3,045 25,565 12,208 95,008 156,127 65,359 $10,000 -$14,999 16,699 2,987 19,294 6,957 48,609 94,546 26,766 $15,000 -$24,999 33,071 6,735 40,518 14,177 92,798 187,300 49,797 $25,000 -$34,999 36,346 6,794 43,412 11,683 86,906 185,141 41,705 $35,000 -$49,999 47,806 6,560 59,812 16,802 105,319 236,299 42,950 $50,000 -$74,999 69,744 12,826 86,824 23,628 134,779 327,802 48,553 $75,000 -$99,999 48,788 10,015 67,048 15,621 76,595 218,067 20,541 $100,000 -$149,999 40,602 6,911 78,624 16,802 64,812 207,751 11,827 $150,000 -$199,999 9,496 1,523 31,353 7,351 17,676 67,399 2,490 $200,000 or more 4,912 1,171 30,389 6,170 12,520 55,161 1,556 327,765 58,567 482,840 131,399 735,022 1,735,594 311,545 TOTALS An increased expenditure on local hamburger could be modeled as increased spending at a local fast food restaurant, increased spending at a supermarket, increased hamburger processing, or increased cattle raising. To avoid double counting for each food expenditure, only one localizing purchase event was chosen -- if possible, high value-added production rather than low value-added retail. The following events were modeled: • More local production of dry goods, dairy, processed fruits and vegetables, sugars and sweets, fats, oils, and all kinds of beverages. • More local processing of beef, pork, other meat, chicken, and fish. • More local production of eggs. • More local growing of fruits and vegetables. • More local restaurant spending. Table 3: Food Expenditures for 5-County Region 5-Counties ALL FOOD $10,799,657,991 FOOD AT HOME $5,922,220,561 Cereal & Bakery Products $798,373,127 •Cerals & Cereal Products $256,183,626 •Bakery Products $542,176,660 Meats, Poultry, Fish, Eggs $1,368,708,305 •Beef $407,757,456 •Pork $271,921,809 •Other Meats $184,881,067 •Poultry $240,279,923 •Fish & Seafoods $205,725,628 processed fruits and vegetables, •Eggs $57,229,706 sweets, fats, oils, and all kinds$678,429,920 of Dairy Products •Fresh Milk & Cream $259,632,294 •Other Dairy Products $418,440,069 Fruits & Vegetables $992,395,752 •Fresh Fruits $327,978,625 •Fresh Vegetables $315,248,272 •Processed Fruits $189,935,894 •Processed Vegetables $158,604,515 Other Food at Home $2,083,645,882 •Sugar & Other Sweets $213,137,512 •Fats & Oils $150,864,530 •Misc. Foods $1,097,242,689 •Nonalcoholic Beverages $542,761,646 •Food Prepared on Trips $77,527,668 FOOD AWAY FROM HOME $4,877,007,669 ALCOHOLIC BEVERAGES $787,175,707 Detroit $1,528,685,112 $881,730,217 $119,339,752 $38,487,632 $80,881,127 $206,785,301 $60,554,807 $42,727,697 $27,926,031 $36,750,137 $29,435,267 $9,261,826 $101,207,570 $40,513,517 $60,613,133 $146,631,052 $47,861,316 $46,220,116 $28,306,172 $24,209,150 $307,614,722 $31,641,854 $23,288,582 $160,477,604 $82,322,887 $9,215,390 $646,914,933 $104,777,798 CONSERVATISMS: These calculations likely understate the potential impacts of localizing food expenditures, for the following reasons: • If multiple events had been specified for each category of food expenditure, the impacts would be greater. • The IMPLAN model shows a typical purchase at an entity within the region, but has no data about the ownership of businesses. A number of studies have shown that a dollar spent at a locally owned business within a region, like a restaurant, can generate two to four times the multiplier benefit of an entity that is not locally owned. • Other expenditures related to food and farming systems were not included, including wood, wood products, furniture, biofuels, biochemicals, leather, leather products, shoes, fiber, and apparel. 1 Michael H. Shuman, an economist and attorney, is Vice President for Enterprise Development for the Training & Development Corporation, based in Bucksport, Maine. He is the author of a half-dozen books and more than 100 articles, primarily on community development. His most recent books are The Small-Mart Revolution: How Local Businesses Are Beating the Global Competition (Berrett-Koehler, 2006) and Going Local: Creating Self-Reliant Communities is a Global Age (Free Press, 1998). He received his bachelors (1979) and law degrees (1982) from Stanford University. fairfoodfoundation.org


