Discover the Waters of Tennessee 8
advertisement
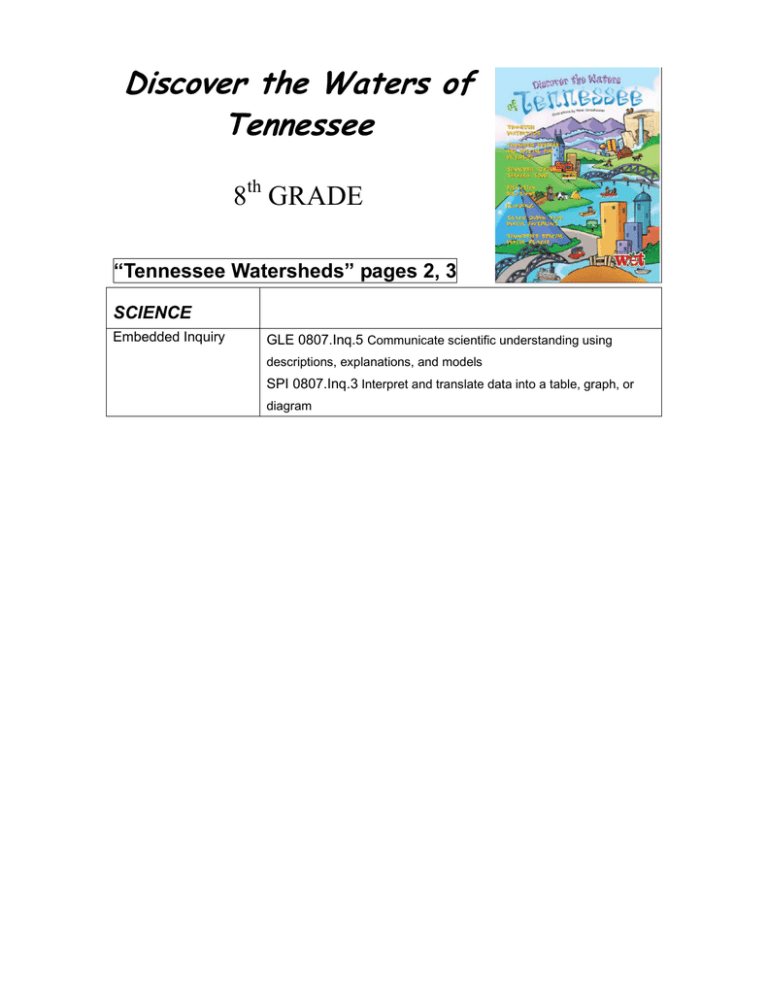
Discover the Waters of Tennessee 8th GRADE “Tennessee Watersheds” pages 2, 3 SCIENCE Embedded Inquiry GLE 0807.Inq.5 Communicate scientific understanding using descriptions, explanations, and models SPI 0807.Inq.3 Interpret and translate data into a table, graph, or diagram “Tennessee Waters are Special for Wildlife” pages 4, 5 SCIENCE Embedded Inquiry GLE 0807.Inq.5 Communicate scientific understanding using descriptions, explanations, and models SPI 0807.Inq.3 Interpret and translate data into a table, graph, or diagram Life Science – Biodiversity and Change GLE 0807.5.3 Analyze how structural, behavioral, and physiological adaptations within a population enable it to survive in a given environment GLE 0807.5.5 Describe the importance of maintaining the earth’s biodiversity d atmosphere 0807.5.3 Compare and contrast the ability of an organism to survive under different environmental conditions 0807.5.4 Collect and analyze data relating to variation within a population of organisms 0807.5.5 Prepare a poster that illustrates the major factors responsible for reducing the amount of global biodiversity “Tennessee Rivers through Time” pages 6, 7 SCIENCE Embedded Inquiry GLE 0807.Inq.5 Communicate scientific understanding using descriptions, explanations, and models SPI 0807.Inq.3 Interpret and translate data into a table, graph, or diagram Embedded Technology & Engineering GLE 0807.T/E.1 Explore how technology responds to social, political, and economic needs GLE 0807.T/E.3 Compare the intended benefits with the unintended consequences of a new technology Life Science – Biodiversity and Change GLE 0807.5.6 Investigate fossils in sedimentary rock layers to gather evidence of changing life forms 0807.5.6 Prepare graphs that demonstrate how the amount of biodiversity has changed in a particular continent or biome 0807.5.7 Create a timeline that illustrates the relative ages of fossils in sedimentary rock layers SPI 0807.5.2 Analyze structural, behavioral and physiological adaptations to predict which populations are likely to survive in a particular environment SPI 0807.5.3 Analyze data on levels of variation within a population to make predictions about survival under particular environmental conditions SPI 0807.5.4 Identify several reasons for the importance of maintaining the earth’s biodiversity SPI 0807.5.5 Compare fossils found in sedimentary rock to determine their relative age “Pollution Solution” pages 8, 9 SCIENCE Embedded Inquiry GLE 0807.Inq.5 Communicate scientific understanding using descriptions, explanations, and models SPI 0807.Inq.3 Interpret and translate data into a table, graph, or diagram “Flooding” pages 10, 11 SCIENCE Embedded Inquiry GLE 0807.Inq.2.Use appropriate tools and techniques to gather, organize, analyze, and interpret data GLE 0807.Inq.3 Synthesize information to determine cause and effect relationships between evidence and explanations 0807.Inq.2 Identify tools and techniques needed to gather, organize, analyze, and interpret data collected from a moderately complex scientific investigation 0807.Inq.3 Use evidence from a dataset to determine cause and effect relationships that explain a phenomenon 0807.Inq.5 Design a method to explain the results of an investigation using descriptions, explanations, or models SPI 0807.Inq.3 Interpret and translate data into a table, graph, or diagram SPI 0807.Inq.4 Draw a conclusion that establishes a cause and effect relationship supported by evidence MATH Strand 19: Tables, Graphs and Charts A. Identify correct information from tables, graphs, and charts Strand 20: Statistics and Data Analysis A. Drop reasonable conclusions from data in tables, graphs, and B. Create graphs from data in tables and charts charts B. State a conclusion and explain why an answer is or is not reasonable based on the data C. Solve problems involving means, medians, modes, and ranges of sets of data “Track Down Your Water Footprint” pages 12, 13 SCIENCE Embedded Inquiry GLE 0807.Inq.2.Use appropriate tools and techniques to gather, organize, analyze, and interpret data GLE 0807.Inq.3 Synthesize information to determine cause and effect relationships between evidence and explanations GLE 0807.Inq.5 Communicate scientific understanding using descriptions, explanations and models 0807.Inq.5 Design a method to explain the results of an investigation using descriptions, explanations, or models SPI 0807.Inq.3 Interpret and translate data in a table, graph, or diagram SPI 0807.Inq.4 Draw a conclusion that establishes a cause and effect relationship supported by evidence MATH Strand 19: Tables, Graphs and Charts A. Identify correct information from tables, graphs, and charts Strand 20: Statistics and Data Analysis A. Drop reasonable conclusions from data in tables, graphs, and B. Create graphs from data in tables and charts charts B. State a conclusion and explain why an answer is or is not reasonable based on the data C. Solve problems involving means, medians, modes, and ranges of sets of data “Tennessee Special Water Places” pages 14, 15 SCIENCE Life Science – Biodiversity and Change GLE 0807.5.5 Describe the importance of maintaining the earth’s biodiversity SPI 0807.5.4 Identify several reasons for the importance of maintaining the earth’s biodiversity Please: share your feedback and reward your class with a Certificate of Completion!! CONTACT: Cynthia Allen, callen@mtsu.edu, 615-898-2660, WaterWorks! Coordinator MTSU ‘s Center for Environmental Education Special thanks to Bonnie Ervin, Kathy DeWein and Michelle Rogers for their assistance correlating the standards.

