Table T2: Non-UK Domiciled Student Numbers by Ethnic Group 2012-13
advertisement
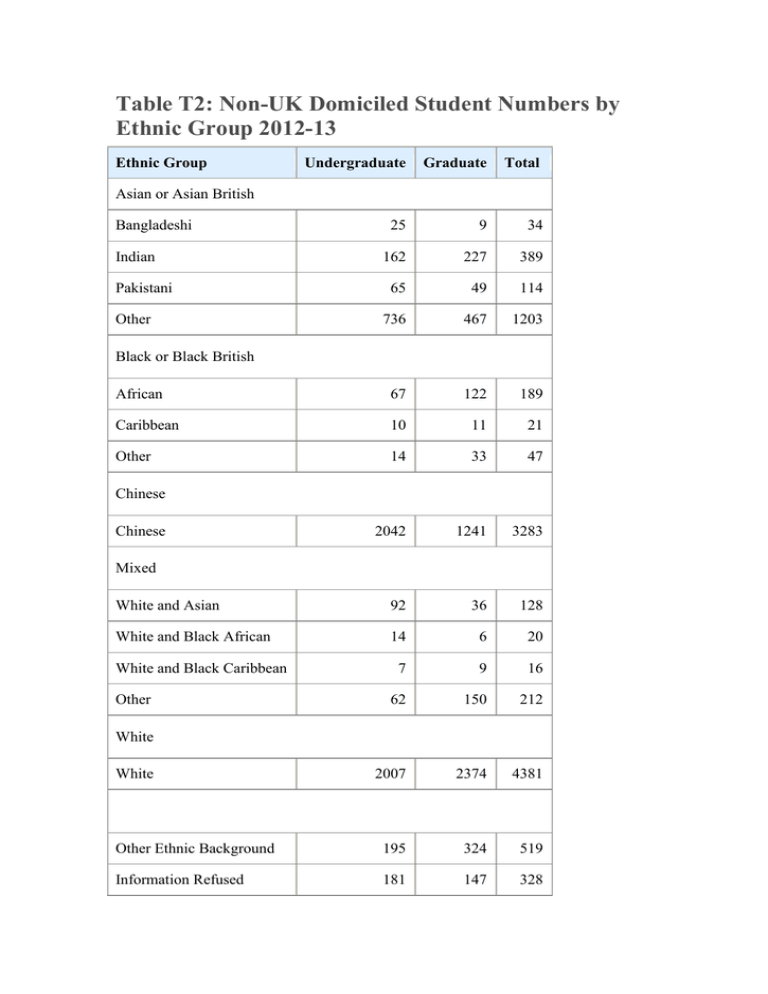
Table T2: Non-UK Domiciled Student Numbers by Ethnic Group 2012-13 Ethnic Group Undergraduate Graduate Total 25 9 34 162 227 389 65 49 114 736 467 1203 African 67 122 189 Caribbean 10 11 21 Other 14 33 47 2042 1241 3283 White and Asian 92 36 128 White and Black African 14 6 20 7 9 16 62 150 212 2007 2374 4381 Other Ethnic Background 195 324 519 Information Refused 181 147 328 Asian or Asian British Bangladeshi Indian Pakistani Other Black or Black British Chinese Chinese Mixed White and Black Caribbean Other White White Not Known GRAND TOTAL 90 14 104 5769 5219 10988 The information in this table is concerned with those students whose domicile at the time of application is outside the UK.

