Draft Ramapo College Foundation Management’s Discussion and Analysis - Unaudited
advertisement
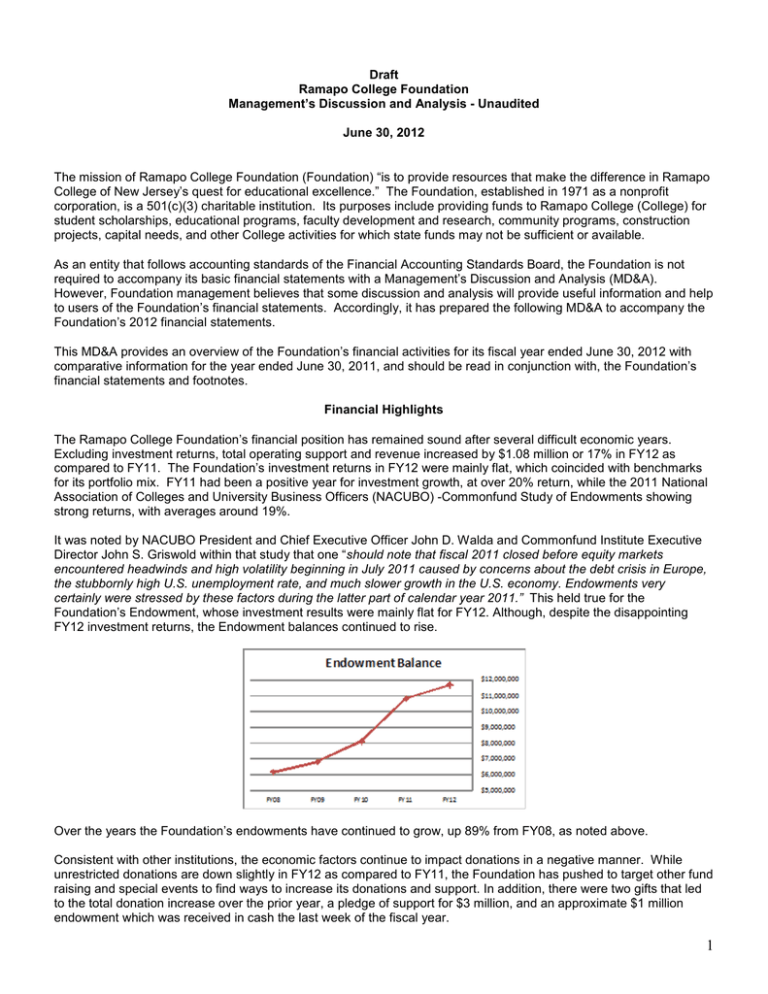
Draft Ramapo College Foundation Management’s Discussion and Analysis - Unaudited June 30, 2012 The mission of Ramapo College Foundation (Foundation) “is to provide resources that make the difference in Ramapo College of New Jersey’s quest for educational excellence.” The Foundation, established in 1971 as a nonprofit corporation, is a 501(c)(3) charitable institution. Its purposes include providing funds to Ramapo College (College) for student scholarships, educational programs, faculty development and research, community programs, construction projects, capital needs, and other College activities for which state funds may not be sufficient or available. As an entity that follows accounting standards of the Financial Accounting Standards Board, the Foundation is not required to accompany its basic financial statements with a Management’s Discussion and Analysis (MD&A). However, Foundation management believes that some discussion and analysis will provide useful information and help to users of the Foundation’s financial statements. Accordingly, it has prepared the following MD&A to accompany the Foundation’s 2012 financial statements. This MD&A provides an overview of the Foundation’s financial activities for its fiscal year ended June 30, 2012 with comparative information for the year ended June 30, 2011, and should be read in conjunction with, the Foundation’s financial statements and footnotes. Financial Highlights The Ramapo College Foundation’s financial position has remained sound after several difficult economic years. Excluding investment returns, total operating support and revenue increased by $1.08 million or 17% in FY12 as compared to FY11. The Foundation’s investment returns in FY12 were mainly flat, which coincided with benchmarks for its portfolio mix. FY11 had been a positive year for investment growth, at over 20% return, while the 2011 National Association of Colleges and University Business Officers (NACUBO) -Commonfund Study of Endowments showing strong returns, with averages around 19%. It was noted by NACUBO President and Chief Executive Officer John D. Walda and Commonfund Institute Executive Director John S. Griswold within that study that one “should note that fiscal 2011 closed before equity markets encountered headwinds and high volatility beginning in July 2011 caused by concerns about the debt crisis in Europe, the stubbornly high U.S. unemployment rate, and much slower growth in the U.S. economy. Endowments very certainly were stressed by these factors during the latter part of calendar year 2011.” This held true for the Foundation’s Endowment, whose investment results were mainly flat for FY12. Although, despite the disappointing FY12 investment returns, the Endowment balances continued to rise. Over the years the Foundation’s endowments have continued to grow, up 89% from FY08, as noted above. Consistent with other institutions, the economic factors continue to impact donations in a negative manner. While unrestricted donations are down slightly in FY12 as compared to FY11, the Foundation has pushed to target other fund raising and special events to find ways to increase its donations and support. In addition, there were two gifts that led to the total donation increase over the prior year, a pledge of support for $3 million, and an approximate $1 million endowment which was received in cash the last week of the fiscal year. 1 The Foundation continues to reach its alumni supporters, with FY11’s participation rates at 7.8%, as compared to the national average of 4.9% for colleges classified as Public Master’s Degree granting institutions (as calculated for the VSE, soft credits not included). As a percentage of alumni solicited, the rate was 8.8%. Statements of Activities The Statement of Activities reports information on the Foundation and its activities during an accounting period. When operating support and revenue exceed expenses, the result is an increase in net assets. When the reverse occurs, the result is a decrease in net assets. The relationship between operating support and revenue and expenses may be thought of as the Foundation’s operating results. This Statement also shows the Foundation’s net assets and changes to them. The Foundation’s net assets – the difference between assets and liabilities – is one way to measure the Foundation’s financial health or position. Over time, increases or decreases in the Foundation’s net assets is one indicator of whether its financial health is improving or deteriorating. Trends are important to monitor, but in any given year a significant change in net assets may result from a unique event such as receipt of a significant grant or a capital payment to the College. Consideration must also be given not only to net asset trends, but also to non-financial factors that can reflect on the overall health of the Foundation and the College. Revenue and Operational Support (in thousands) As shown above, the Foundation receives support and revenue from a variety of sources. These sources include donations, fund raising, grants, special events, bequests and other planned giving instruments, pledges, investment income and gifts-in-kind. Excluding the market return on investments, total support and revenue increased over $1 million from $6.3 million in FY11 to $7.4 million in FY12, which was driven by increases to donations year-over-year. 2 Expenses (in thousands) Expenses decreased slightly from $4.59 million in FY11 to $4.51 million in FY12. Restricted Grants Expenses remained the single largest category of expense at $1.96 million and $2.03 million for fiscal years 2012 and 2011, respectively, the largest grant being the Meadowlands Grant for both periods. The majority of expenses were down in FY12 as compared to FY11, except for Scholarships and Awards and College Grants, which increased about $80 thousand or 18% from FY11. This was mainly driven by the investment increases from FY11, and the release of those payments in FY12. Condensed Statement of Financial Position 3 The Statement of Financial Position shows the residual interest in the Foundation’s assets after liabilities are deducted as of June 30, 2012 and 2011. Net assets are divided into three categories as shown here and rounded to thousands of dollars: Total net assets increased by $2.89 million, or 17% from $16.71 million in FY11 to $19.60 million in FY12. Mainly driven by donations during FY12, as noted in the increase in permanently restricted assets. Statement of Cash Flows Another way to view financial health is to look at the Statement of Cash Flows. Its primary purpose is to provide relevant information about cash receipts and cash payments of an entity during an accounting period; the financial data below is for the fiscal years ended June 30, 2012 and June 30, 2011. The Statement of Cash Flows also helps users assess an entity’s ability to generate cash and its ability to meet its obligations. It should be noted that there is often a timing difference between when cash is received by an organization and released, so several years should be reviewed to determine the pattern of cash flows. As noted, the Foundation received a significant cash inflow from contributions in FY12, as compared to FY11. The flow of cash relates to the timing of monies received in a year, and do not always correlate to donation revenue Future Outlook The Foundation will continue to emphasize the need for endowment support, and seek to grow the planned giving legacy programs, secure significant capital support to renovate academic facilities, and increase annual fund participation levels. The Foundation’s five-year Strategic Plan to ensure measurable strides are made for the Capital Campaign has surpassed its original goal of $40 million with over $42 million committed as of June 30, 2012. 4
