Ecological Archives
advertisement

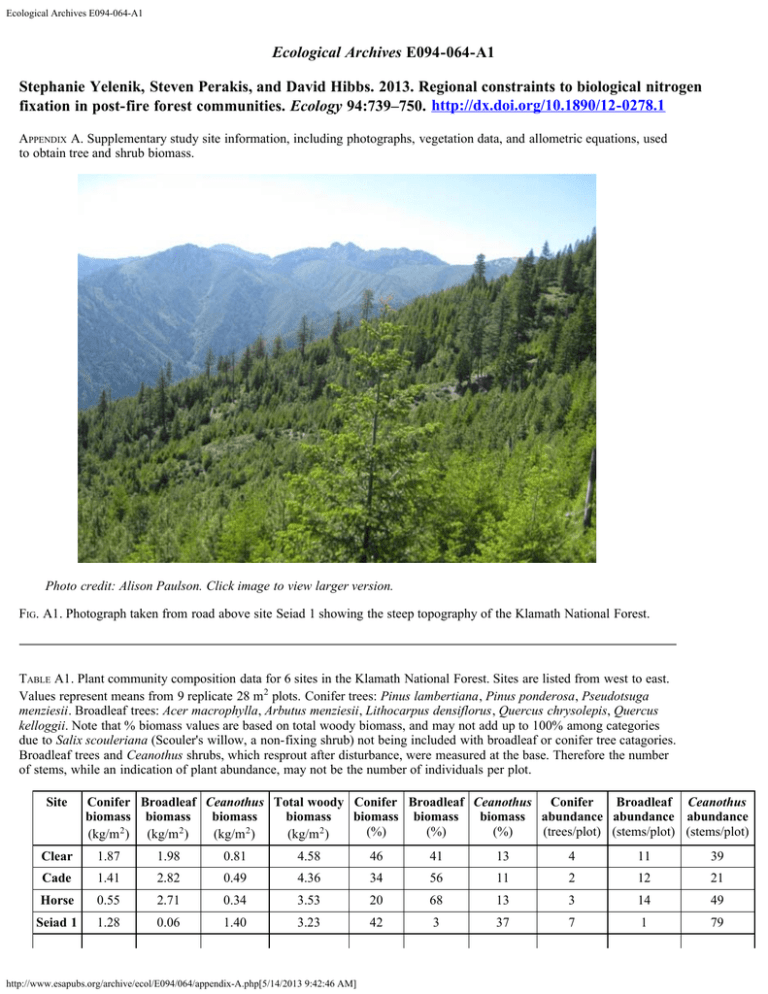
Ecological Archives E094-064-A1 Ecological Archives E094-064-A1 Stephanie Yelenik, Steven Perakis, and David Hibbs. 2013. Regional constraints to biological nitrogen fixation in post-fire forest communities. Ecology 94:739–750. http://dx.doi.org/10.1890/12-0278.1 APPENDIX A. Supplementary study site information, including photographs, vegetation data, and allometric equations, used to obtain tree and shrub biomass. Photo credit: Alison Paulson. Click image to view larger version. FIG. A1. Photograph taken from road above site Seiad 1 showing the steep topography of the Klamath National Forest. TaBLE A1. Plant community composition data for 6 sites in the Klamath National Forest. Sites are listed from west to east. Values represent means from 9 replicate 28 m 2 plots. Conifer trees: Pinus lambertiana, Pinus ponderosa, Pseudotsuga menziesii. Broadleaf trees: Acer macrophylla, Arbutus menziesii, Lithocarpus densiflorus, Quercus chrysolepis, Quercus kelloggii. Note that % biomass values are based on total woody biomass, and may not add up to 100% among categories due to Salix scouleriana (Scouler's willow, a non-fixing shrub) not being included with broadleaf or conifer tree catagories. Broadleaf trees and Ceanothus shrubs, which resprout after disturbance, were measured at the base. Therefore the number of stems, while an indication of plant abundance, may not be the number of individuals per plot. Site Broadleaf Ceanothus Conifer Broadleaf Ceanothus Total woody Conifer Broadleaf Ceanothus Conifer biomass biomass biomass biomass biomass abundance abundance abundance biomass biomass (%) (%) (%) (trees/plot) (stems/plot) (stems/plot) (kg/m 2 ) (kg/m 2 ) (kg/m 2 ) (kg/m 2 ) Clear 1.87 1.98 0.81 4.58 46 41 13 4 11 39 Cade 1.41 2.82 0.49 4.36 34 56 11 2 12 21 Horse 0.55 2.71 0.34 3.53 20 68 13 3 14 49 Seiad 1 1.28 0.06 1.40 3.23 42 3 37 7 1 79 http://www.esapubs.org/archive/ecol/E094/064/appendix-A.php[5/14/2013 9:42:46 AM] Ecological Archives E094-064-A1 Seiad 2 1.11 1.12 1.02 3.11 33 35 32 2 8 89 Seiad 3 1.66 0.43 0.71 2.87 50 13 20 9 5 50 TaBLE A2. Allometric equations used to estimate forest community biomass (kg). Abbreviations: BD, basal diameter; DBH, diameter at breast hieght (137 cm); HT, height. BD, DBH, and HT are in cm, and biomass is in kg, unless otherwise noted. When no equation existed for small diameters, one was estimated with a linear function between the zero intercept and the lowest value that could be estimated with the published equation. For species that did not have a published allometric equation, we substituted equations for related species with similar habits. These included P. lambertiana (used P. ponderosa equations) and Q. chrysolepis (used L. densiflorus equations). Species Plant part Size range Equation Source Acer macrophylla > 137 cm HT Biomass = 0.644 (DBH) 2 - 7.556 (DBH) + 38.868 (Kendall Snell and Little 1983) Arbutus menziesii < 2.54 cm DBH Biomass = 0.665 DBH linear estimation Ceanothus integerrimus leaves Lithocarpus densiflorus > 2.54 cm DBH Biomass = 0.494 (DBH) - 1.898 DBH + 3.325 (Kendall Snell and Little 1983) ln(Biomass (g)) = -2.371 + 1.813 × ln (BD (mm)) (Hughes et al. 1987) ln(Biomass (g)) = -2.605 + 2.630 × ln(BD (mm)) (Hughes et al. 1987) < 2.54 cm DBH Biomass = 0.5 (DBH) (Kendall Snell and Little 1983) > 2.54 cm DBH Biomass = 0.461 (DBH) 2 - 1.348 (DBH) + 1.724 (Kendall Snell and Little 1983) 29–330 cm HT ln(Biomass (g)) = -5.255 + 2.512 × ln(HT) (Halpern and Means 2004) > 330cm HT Biomass (g) = 1160 + 0.187 (DBH) 2 × HT (Halpern and Means 2004) 29–330 cm HT ln(Biomass (g)) = -5.255 + 2.512 × ln(HT) (Halpern and Means 2004) > 330cm HT Biomass (g) = 1160 + 0.187 (DBH) 2 × HT (Halpern and Means 2004) < 137 cm HT ln(Biomass) = 4.247 + 1.630 × ln(BD) (Halpern and Means 2004) stems Pinus ponderosa Pinus lambertiana Pseudotsuga menziesii Quercus chrysolepis 2 > 137 cm HT Biomass = 1054 + 0.206 (DBH) × HT (Halpern and Means 2004) < 2.54 cm DBH Biomass = 1.147 (DBH) linear estimation > 2.54 cm DBH Biomass = 0.658 (DBH) 2 - 3.986 (DBH) + 8.795 (Kendall Snell and Little 1983) 2 Quercus kellogii ln(Biomass (g)) = -4.498 + 0.723 × ln(BD) + 1.723 × ln(HT) (Halpern and Means 2004) Salix scouleriana ln(Biomass (g)) = 3.460 + 2.389 × ln(BD) (Halpern and Means 2004) LItERatURE CItED Halpern, C., and J. Means. 2004. Pacific Northwest plant biomass component equation library. Long-Term Ecological Research. Forest Science Data Bank, Corvallis, OR. http://andrewsforest.oregonstate.edu/data/abstract.cfm?dbcode=TP072 (October 11, 2011). Hughes, T. F., C. R. Latt, Tappeiner, II, C. John, and M. Newton. 1987. Biomass and leaf-area estimates for varnishleaf ceanothus, deerbrush, and whiteleaf manzanita. Western Journal of Applied Forestry 2:124–128. Kendall Snell, J. A., and S. N. Little. 1983. Predicting crown weight and bole volume of five Western hardwoods. United States Department of Agriculture Pacific Northwest Forest and Range Experimental Station, Portland, Oregon, USA. http://www.esapubs.org/archive/ecol/E094/064/appendix-A.php[5/14/2013 9:42:46 AM] Ecological Archives E094-064-A1 [Back to E094-064] http://www.esapubs.org/archive/ecol/E094/064/appendix-A.php[5/14/2013 9:42:46 AM]


