50 BANCO DE PORTUGAL • Boletim Estatístico A.15
advertisement

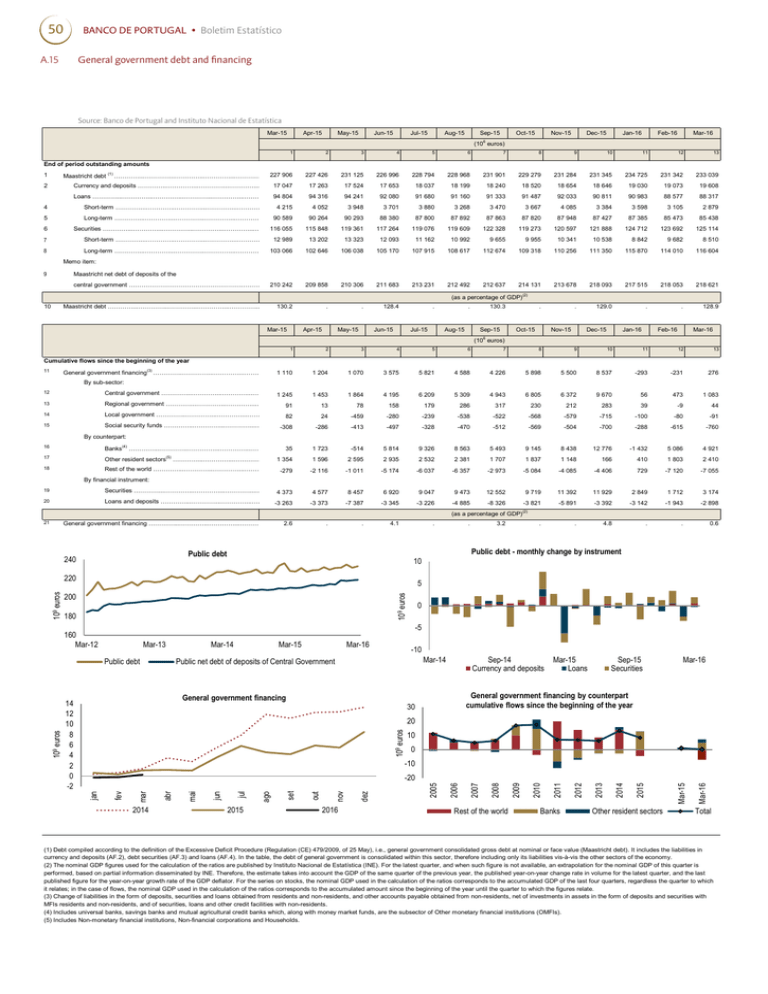
50 BANCO DE PORTUGAL • Boletim Estatístico General government debt and financing A.15 Source: Banco de Portugal and Instituto Nacional de Estatística Mar-15 Apr-15 May-15 Jun-15 Jul-15 Aug-15 Sep-15 Oct-15 Nov-15 Dec-15 Jan-16 Feb-16 Mar-16 6 (10 euros) 1 2 3 4 5 6 7 8 9 10 11 12 13 227 906 227 426 231 125 226 996 228 794 228 968 231 901 229 279 231 284 231 345 …………...…………...…………...…………...…………...…………...…………...…………...…………...…………...…………...…………...…………...…………...…………...…………… 233 039 End of period outstanding amounts 1 234 725 231 342 17 047 17 263 17 524 17 653 18 037 18 199 18 240 18 520 18 654 18 646 19 030 Currency and deposits …………...…………...…………...…………...…………...…………...…………...…………...…………...…………...…………...…………...…………...…………...…………...…………… 19 073 19 608 Loans …………...…………...…………...…………...…………...…………...…………...…………...…………...…………...…………...…………...…………...…………...…………...…………… 94 804 94 316 94 241 92 080 91 680 91 160 91 333 91 487 92 033 88 577 88 317 Maastricht debt 2 (1) 90 811 90 983 4 Short-term …………...…………...…………...…………...…………...…………...…………...…………...…………...…………...…………...…………...…………...…………...…………...…………… 4 215 4 052 3 948 3 701 3 880 3 268 3 470 3 667 4 085 3 384 3 598 3 105 2 879 5 Long-term …………...…………...…………...…………...…………...…………...…………...…………...…………...…………...…………...…………...…………...…………...…………...…………… 90 589 90 264 90 293 88 380 87 800 87 892 87 863 87 820 87 948 87 427 87 385 85 473 85 438 125 114 6 Securities …………...…………...…………...…………...…………...…………...…………...…………...…………...…………...…………...…………...…………...…………...…………...…………… 116 055 115 848 119 361 117 264 119 076 119 609 122 328 119 273 120 597 121 888 124 712 123 692 7 Short-term …………...…………...…………...…………...…………...…………...…………...…………...…………...…………...…………...…………...…………...…………...…………...…………… 12 989 13 202 13 323 12 093 11 162 10 992 9 655 9 955 10 341 10 538 8 842 9 682 8 510 8 Long-term …………...…………...…………...…………...…………...…………...…………...…………...…………...…………...…………...…………...…………...…………...…………...…………… 103 066 102 646 106 038 105 170 107 915 108 617 112 674 109 318 110 256 111 350 115 870 114 010 116 604 Memo item: 9 Maastricht net debt of deposits of the central government ……………………………………………….……………………………………………….……………………………………………….……………………………………………….……………………………………………….…………………………… 210 242 209 858 210 306 211 683 213 231 212 492 212 637 214 131 213 678 218 093 217 515 218 053 218 621 (as a percentage of GDP) 10 (2) 130.2 . . 128.4 . . 130.3 . . 129.0 Maastricht debt …………...…………...…………...…………...…………...…………...…………...…………...…………...…………...…………...…………...…………...…………...…………...…………… Mar-15 Apr-15 May-15 Jun-15 Jul-15 Aug-15 Sep-15 Oct-15 Nov-15 . Dec-15 Jan-16 . Feb-16 128.9 Mar-16 6 (10 euros) 1 2 3 4 5 6 7 8 9 10 11 12 13 General government financing(3) …………...…………...…………...…………...…………...…………...…………...…………...…………...…………...…………...…………...…………...…………...…………… 1 110 1 204 1 070 3 575 5 821 4 588 4 226 5 898 5 500 8 537 -293 -231 276 12 Central government …………...…………...…………...…………...…………...…………...…………...…………...…………...…………...…………...…………...…………...…………...…………...…………... 1 245 1 453 1 864 4 195 6 209 5 309 4 943 6 805 6 372 9 670 56 473 1 083 13 Regional government …………...…………...…………...…………...…………...…………...…………...…………...…………...…………...…………...…………...…………...…………...…………...…………… 91 13 78 158 179 286 317 230 212 283 39 14 Cumulative flows since the beginning of the year 11 By sub-sector: 15 -9 44 Local government …………...…………...…………...…………...…………...…………...…………...…………...…………...…………...…………...…………...…………...…………...…………...…………… 82 24 -459 -280 -239 -538 -522 -568 -579 -715 -100 -80 -91 Social security funds …………...…………...…………...…………...…………...…………...…………...…………...…………...…………...…………...…………...…………...…………...…………...…………… -308 -286 -413 -497 -328 -470 -512 -569 -504 -700 -288 -615 -760 5 086 4 921 By counterpart: 16 Banks(4) …………...…………...…………...…………...…………...…………...…………...…………...…………...…………...…………...…………...…………...…………...…………...…………… 35 1 723 -514 5 814 9 326 8 563 5 493 9 145 8 438 12 776 17 Other resident sectors(5) …………...…………...…………...…………...…………...…………...…………...…………...…………...…………...…………...…………...…………...…………...…………...…………… 1 354 1 596 2 595 2 935 2 532 2 381 1 707 1 837 1 148 166 410 18 Rest of the world …………...…………...…………...…………...…………...…………...…………...…………...…………...…………...…………...…………...…………...…………...…………...…………… -279 -2 116 -1 011 -5 174 -6 037 -6 357 -2 973 -5 084 -4 085 -4 406 729 -1 432 1 803 2 410 -7 120 -7 055 By financial instrument: 19 Securities …………...…………...…………...…………...…………...…………...…………...…………...…………...…………...…………...…………...…………...…………...…………...…………… 4 373 4 577 8 457 6 920 9 047 9 473 12 552 9 719 11 392 11 929 2 849 1 712 3 174 20 Loans and deposits …………...…………...…………...…………...…………...…………...…………...…………...…………...…………...…………...…………...…………...…………...…………...…………… -3 263 -3 373 -7 387 -3 345 -3 226 -4 885 -8 326 -3 821 -5 891 -3 392 -3 142 -1 943 -2 898 . 0.6 (as a percentage of GDP)(2) General government financing …………...…………...…………...…………...…………...…………...…………...…………...…………...…………...…………...…………...…………...…………...…………...…………… 2.6 . . 4.1 . . 3.2 . . 4.8 Public debt 240 5 109 euros 200 180 Mar-13 Mar-14 Mar-15 Mar-16 -10 Public net debt of deposits of Central Government General government financing Mar-14 Sep-14 Currency and deposits Mar-15 Loans Sep-15 Securities Mar-16 General government financing by counterpart cumulative flows since the beginning of the year 30 109 euros 20 10 0 2014 2015 2016 Rest of the world Banks Other resident sectors Mar-16 Mar-15 2015 2014 2013 2012 2011 2010 2009 2008 2007 dez nov out set ago jul jun abr mar fev -20 2006 -10 jan 109 euros Public debt 14 12 10 8 6 4 2 0 -2 0 -5 160 Mar-12 mai 109 euros 220 . Public debt - monthly change by instrument 10 2005 21 Total (1) Debt compiled according to the definition of the Excessive Deficit Procedure (Regulation (CE) 479/2009, of 25 May), i.e., general government consolidated gross debt at nominal or face value (Maastricht debt). It includes the liabilities in currency and deposits (AF.2), debt securities (AF.3) and loans (AF.4). In the table, the debt of general government is consolidated within this sector, therefore including only its liabilities vis-à-vis the other sectors of the economy. (2) The nominal GDP figures used for the calculation of the ratios are published by Instituto Nacional de Estatística (INE). For the latest quarter, and when such figure is not available, an extrapolation for the nominal GDP of this quarter is performed, based on partial information disseminated by INE. Therefore, the estimate takes into account the GDP of the same quarter of the previous year, the published year-on-year change rate in volume for the latest quarter, and the last published figure for the year-on-year growth rate of the GDP deflator. For the series on stocks, the nominal GDP used in the calculation of the ratios corresponds to the accumulated GDP of the last four quarters, regardless the quarter to which it relates; in the case of flows, the nominal GDP used in the calculation of the ratios corresponds to the accumulated amount since the beginning of the year until the quarter to which the figures relate. (3) Change of liabilities in the form of deposits, securities and loans obtained from residents and non-residents, and other accounts payable obtained from non-residents, net of investments in assets in the form of deposits and securities with MFIs residents and non-residents, and of securities, loans and other credit facilities with non-residents. (4) Includes universal banks, savings banks and mutual agricultural credit banks which, along with money market funds, are the subsector of Other monetary financial institutions (OMFIs). (5) Includes Non-monetary financial institutions, Non-financial corporations and Households.


