Financial Markets and the Macroeconomy. Slides for 23 September 2003 lecture 1
advertisement
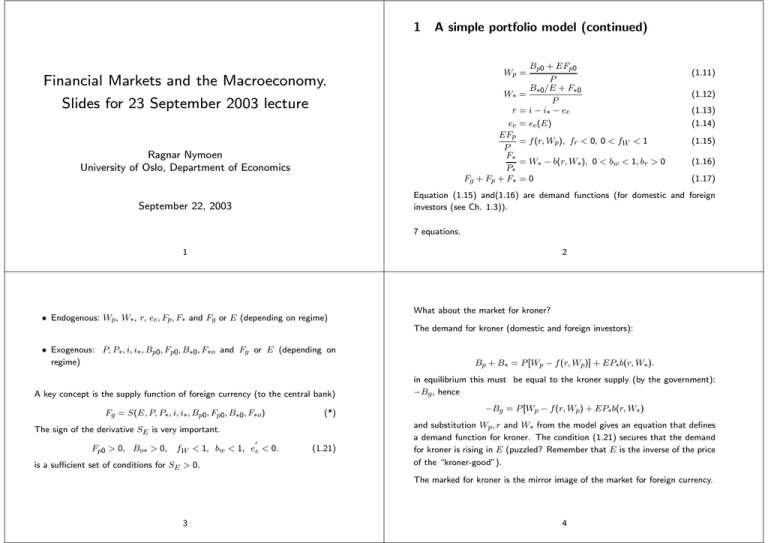
1 A simple portfolio model (continued) Bp0 + EFp0 P B∗0/E + F∗0 W∗ = P r = i − i∗ − ee Wp = Financial Markets and the Macroeconomy. Slides for 23 September 2003 lecture ee EFp P F∗ P∗ Fg + Fp + F∗ Ragnar Nymoen University of Oslo, Department of Economics (1.11) (1.12) (1.13) = ee(E) (1.14) = f (r, Wp), fr < 0, 0 < fW < 1 (1.15) = W∗ − b(r, W∗), 0 < bw < 1, br > 0 (1.16) =0 (1.17) Equation (1.15) and(1.16) are demand functions (for domestic and foreign investors (see Ch. 1.3)). September 22, 2003 7 equations. 2 1 • Endogenous: Wp, W∗, r, ee, Fp, F∗ and Fg or E (depending on regime) • Exogenous: P, P∗, i, i∗, Bp0, Fp0, B∗0, F∗o and Fg or E (depending on regime) A key concept is the supply function of foreign currency (to the central bank) Fg = S(E, P, P∗, i, i∗, Bp0, Fp0, B∗0, F∗o) (*) The sign of the derivative SE is very important. Fp0 > 0, Bo∗ > 0, 0 fW < 1, bw < 1, ee < 0. is a sufficient set of conditions for SE > 0. (1.21) What about the market for kroner? The demand for kroner (domestic and foreign investors): Bp + B∗ = P [Wp − f (r, Wp)] + EP∗b(r, W∗). in equilibrium this must be equal to the kroner supply (by the government): −Bg , hence −Bg = P [Wp − f (r, Wp) + EP∗b(r, W∗) and substitution Wp, r and W∗ from the model gives an equation that defines a demand function for kroner. The condition (1.21) secures that the demand for kroner is rising in E (puzzled? Remember that E is the inverse of the price of the “kroner-good”). The marked for kroner is the mirror image of the market for foreign currency. 3 4 Capital mobility affects the supply curve fundamentally: Capital mobility (OEM Ch.1.5) • From (1.19): The higher κ is, the more elastic S-curve (“flatter”) The expression for the slope of the supply curve is P P 0 SE = 2 γ − κee E E (1.19) • The higher κ is, the larger horizontal shift results from a 1 pp increase in the rate of interest, i.e., form (1.8): where Si = EFp0 B + (1 − bw ) ∗0 “revaluation effect” P P EP∗ “expectations effect”. br ) > 0 κ = (−fr + P We define κ as the coefficient of capital mobility. It measures by how much the supply changes when the risk premium increases by one pp. γ = (1 − fW ) P κ>0 E In fact we can write SE as 0 P γ − Siee 2 E showing again the decomposition into a revaluation effect and an expectations effect. The expectations effect: SE = 0 E %→ ee &→ r %−→ demand for kroner increases 6 5 price: NOK/USD low cap mob E The degree of capital mobility and policy regimes As long as κ < ∞ (we say that) capital mobility is imperfect (due to risk aversion, transaction costs, differing expectations etc.). When κ → ∞ capital mobility becomes perfect. S high cap mob Fg SE (and Si) → ∞ as κ → ∞ Figure 1: The impact of capital mobility on the supply curve 7 8 Fixed exchange rate Formally, assume an increase in i∗. From the equilibrium condition: In this regime, E is the target of (monetary) policy. The policy instrument is either foreign exchange reserves, Fg or the interest rate i. We maintain that 0 ee < 0 and γ > 0. When Fg is the instrument, Fg is endogenous, while E and i are exogenous (when we later introduce the domestic money market the exogeneity of i does not necessarily follow). The degree of capital mobility is essential for operation of this regime, since it affects how much Fg must change in order to stability E after a shift in the S−curve. ½ ¾ P f (r, Wp) + P∗(W∗ − b(r, W∗)) E ( Bp0 + EFp0 P Fg = − f (i − i∗ − ee(E), ) E P ) B∗0/E + F∗0 B∗0/E + F∗0 +P∗( − b(i − i∗ − ee(E), )) , P P Fg = − take E as exogenous and find the partial derivative of Fg (the instrument), with respect to i∗ P ∂Fg = −Si = − κ < 0 ∂i∗ E If κ is large, reserves can be emptied “overnight”. 9 10 Floating exchange rate Maintain Fixed exchange rate, i as an (endogenous) instrument 0 ee < 0 and γ > 0 Assume again that i∗ increases. From eq. condition, i must increase by the same amount, irrespective of κ (since both Fg and E are exogenous). In a clean float, Fg is (exogenous) and constant. The policy instrument, i, is now free to target other variables. For example money supply of the price level/rate of inflation. Hence i is not determined in the market for foreign exchange. On the other hand, setting the interest rate to attain e.g., the inflation rate has important spill-over effects to the exchange rate. In practice, governments have often tried to defend the exchange rate by a combination of Fg and i-policies. Sweden and Norway in November, December 1992 are good examples. For later reference we therefore note that the eq condition Fg = S(E, P, P∗, i, i∗, Bp0, Fp0, B∗0, F∗o), now defines E as a function of i. The derivative of this function is ∂E 0 = SE + Si, hence ∂i P κ 1 ∂E E =− γ <0 =−P P κe0 0 ∂i γ − − e e 2 E e E κE 11 12 (1.24) Note κ→∞⇒ ∂E 1 = 0 <0 ∂i ee E Ei curve, high cap mob hence the Ei-curve is downward sloping also when there is perfect capital mobility, as long as expectations are regressive. Ei curve, low cap mob i Figure 2: The impact of captial mobility on the Ei-curve 13 14 2 “System of equations” when capital mobility is perfect In general, the model has 7 equations, but when capital mobility is perfect, the model collapses into the uncovered interest rate parity (UIP) condition i = i∗ − ee(E), consistent with the expression for ∂E ∂i above. There is no risk-premium so r = 0. There are no separate demand functions for the two currencies. The Supply curve is a horizontal line. The role of the current account (section 1.6) The model we consider is a stock model. Sudden revaluation of the stocks accounts for the short-run dynamics in the market. This contrasts with the older flow based models of the market for foreign currency. In these models the surplus (or deficit) on the current account is the main explanatory variable. However, we can include the effect of the current account. Assume a stable situation where both the price level and the exchange rate change only gradually, with rates e and p (π in B&W). Private wealth: P Wp = Bp + EFp Differentiate with respect to time: pWp + Ẇp = eFp + 15 16 E Ḟp P 3 The forward market (section 1.7) E Ḟ is net financial investments which is equal to D − D , the current account g P p surplus minus the government surplus, hence Suppose you need 1$ tomorrow (in period t + 1). Ẇp = D − Dg + eFp − pWp By differentiating the eq. condition Fg = − ½ ¾ P f (r, Wp) + P∗(W∗ − b(r, W∗)) E with respect to time, it becomes clear that Ḟp depends on Ẇp, and therefore also D. Graphically, the supply curve “glides” rightwards as a result of D > 0. However, over a short period of time which is the foucus of the stock model, the influence of D > 0 on the market is negligible. See figure 1.7 in the book! The arbitrage principle implies that the two ways of securing one USD tomorrow has the same cost, hence or Et (1 + i). 1 + i∗ (1.30) Ft,t+1 (1 + i) − 1 (1.31) Et Both expression are referred to as the covered interest rate parity condition. In discrete time, the UIP condition can be written i= e Et+1 (1 + i) − 1 (1.32) Et Forward parity means that all forward contracts can be translated into assets and liabilities in the two currencies and we can think as if these are included in the balance sheets that we started out with. i= Empirically, more support for covered interest rate parity than for UIP. 19 Et (1 + i). 1 + i∗ An alternative is to use the forward market. Then you agree today (period t) to pay Ft,t+1 kroner for one USD in period t + 1. Note that this eliminates the risk of seeing the spot rate change unfavourably from t to t + 1. 18 17 Ft,t+1 = You can use the spot market, and buy 1/(1 + i∗) $ today. In terms of kroner, the outlay is Et , 1 + i∗ where Et is the spot exchange rate. If you borrow to do this foreign currency transaction, you must pay one period interest, i.e.,
