PRECISION ANALYSIS OF DEM OBTAINED FROM CARTOSAT STEREO-COUPLE
advertisement
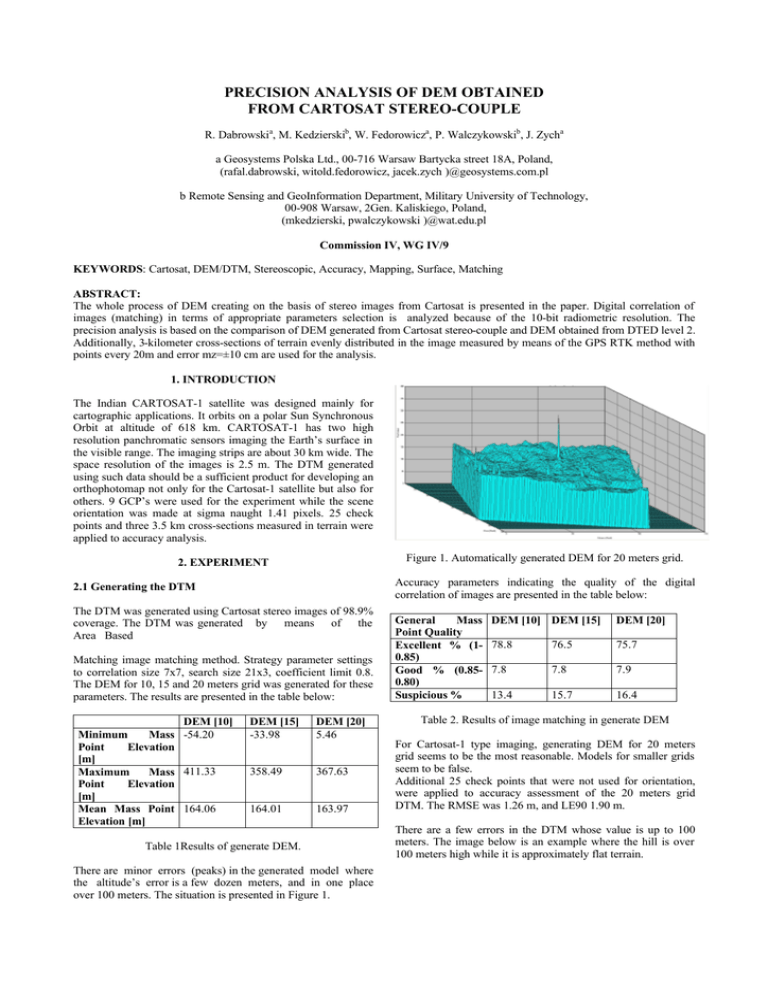
PRECISION ANALYSIS OF DEM OBTAINED FROM CARTOSAT STEREO-COUPLE R. Dabrowskia, M. Kedzierskib, W. Fedorowicza, P. Walczykowskib, J. Zycha a Geosystems Polska Ltd., 00-716 Warsaw Bartycka street 18A, Poland, (rafal.dabrowski, witold.fedorowicz, jacek.zych )@geosystems.com.pl b Remote Sensing and GeoInformation Department, Military University of Technology, 00-908 Warsaw, 2Gen. Kaliskiego, Poland, (mkedzierski, pwalczykowski )@wat.edu.pl Commission IV, WG IV/9 KEYWORDS: Cartosat, DEM/DTM, Stereoscopic, Accuracy, Mapping, Surface, Matching ABSTRACT: The whole process of DEM creating on the basis of stereo images from Cartosat is presented in the paper. Digital correlation of images (matching) in terms of appropriate parameters selection is analyzed because of the 10-bit radiometric resolution. The precision analysis is based on the comparison of DEM generated from Cartosat stereo-couple and DEM obtained from DTED level 2. Additionally, 3-kilometer cross-sections of terrain evenly distributed in the image measured by means of the GPS RTK method with points every 20m and error mz=±10 cm are used for the analysis. 1. INTRODUCTION The Indian CARTOSAT-1 satellite was designed mainly for cartographic applications. It orbits on a polar Sun Synchronous Orbit at altitude of 618 km. CARTOSAT-1 has two high resolution panchromatic sensors imaging the Earth’s surface in the visible range. The imaging strips are about 30 km wide. The space resolution of the images is 2.5 m. The DTM generated using such data should be a sufficient product for developing an orthophotomap not only for the Cartosat-1 satellite but also for others. 9 GCP’s were used for the experiment while the scene orientation was made at sigma naught 1.41 pixels. 25 check points and three 3.5 km cross-sections measured in terrain were applied to accuracy analysis. Figure 1. Automatically generated DEM for 20 meters grid. 2. EXPERIMENT Accuracy parameters indicating the quality of the digital correlation of images are presented in the table below: 2.1 Generating the DTM The DTM was generated using Cartosat stereo images of 98.9% coverage. The DTM was generated by means of the Area Based Matching image matching method. Strategy parameter settings to correlation size 7x7, search size 21x3, coefficient limit 0.8. The DEM for 10, 15 and 20 meters grid was generated for these parameters. The results are presented in the table below: DEM [10] Minimum Mass -54.20 Point Elevation [m] Maximum Mass 411.33 Point Elevation [m] Mean Mass Point 164.06 Elevation [m] DEM [15] -33.98 DEM [20] 5.46 358.49 367.63 164.01 163.97 Table 1Results of generate DEM. There are minor errors (peaks) in the generated model where the altitude’s error is a few dozen meters, and in one place over 100 meters. The situation is presented in Figure 1. General Mass Point Quality Excellent % (10.85) Good % (0.850.80) Suspicious % DEM [10] DEM [15] DEM [20] 78.8 76.5 75.7 7.8 7.8 7.9 13.4 15.7 16.4 Table 2. Results of image matching in generate DEM For Cartosat-1 type imaging, generating DEM for 20 meters grid seems to be the most reasonable. Models for smaller grids seem to be false. Additional 25 check points that were not used for orientation, were applied to accuracy assessment of the 20 meters grid DTM. The RMSE was 1.26 m, and LE90 1.90 m. There are a few errors in the DTM whose value is up to 100 meters. The image below is an example where the hill is over 100 meters high while it is approximately flat terrain. 185,00 Profile 2 180,00 Figure 2. Left hand side: DEM with the error indicated; right hand side: the related region in the orthoimage. Elevation [m] 175,00 170,00 165,00 160,00 DEM Cartosat 155,00 GPS Measurement 150,00 1 Figure 3. Left hand side: error profile; right hand side: the exact location in the orthoimage. 8 15 22 29 36 43 50 57 64 71 78 85 92 99 106 113 120 127 134 141 148 155 190,00 Profile 3 185,00 2.2. Accuracy analysis 180,00 Elevation [m] As it is observed in the images above, the error’s source is rather hard to explain. The central point of the error is where the road crosses the ditch (except for the road, the terrain is covered with snow). 175,00 170,00 The DTM generated using the Cartosat stereo-couple was compared with the DTED Level 2 after resampling to 20 m grid. As a result of extracting one model from the other, a plane of an average altitude of –0.43 m and characteristic errors (peaks) described above was obtained. For more accurate and reliable accuracy analysis of the DTM generated using the Cartosat-1 images, 3.5 km long crosssections with points intervals of 20 m were measured by means of GPS RTK technology. The altitude determination error by means of the GPS technology did not exceed 15 cm in the worst point while horizontal error did not exceed 10 cm. Here we have three cross-sections in the northern, central and southern part of the image. 220,00 165,00 DEM Cartosat GPS Measurement 160,00 1 8 15 Profile 1 78 85 92 99 106 113 120 127 134 141 148 155 Figure 4 Three terrain cross-sections comparison with crosssections measured on the Cartosat-1 DTM. The table including the cross-sections results is presented below mean RMSE Max Min Correlation cofn 215,00 22 29 36 43 50 57 64 71 Profile 1 -0.21 3.60 9.03 -25.65 0.68 Profile 2 -1.47 2.86 11.72 -13.32 0.32 Profile 3 -0.46 1.46 3.64 -3.72 0.95 210,00 Table 3. Results of terrain cross-sections comparison with cross-sections measured on the Cartosat-1 DTM. 205,00 elevation [m] 200,00 195,00 190,00 185,00 180,00 DEM Cartosat 175,00 GPS Measurement 170,00 1 9 17 25 33 41 49 57 65 73 81 89 97 105 113 121 129 137 145 153 161 169 177 The errors in the first profile are caused by frequent crossing over the ditches and roads which causes errors similar to those observed in Fig. 3. The errors in the second profile are systematic and are caused by snow lying in the fields. The errors in the third profile are slight. The research done so far indicates that generating DTM using the Cartosat-1 stereocouple is problematic in the regions of roads and ditches and small woods, especially those including clearings. This suggests that forest areas should be excluded from the process of automatic generating of the DTM. 3. CONLUSION 4. REFERENCE Cartosat-1 stereo images seem to be a good material for DTM generating although errors (peaks) that occur in it may be big in some places. Of course, they can be corrected by means of DTM editing but the experiment considered only automatic generating. When comparing it with results obtained from the Ikonos satellite we may state that the Cartosat DTM is at the same accuracy level or even at a bit higher because GSD is 2.5 times greater than the Ikonos’s, while the DTM accuracy is 1.5 times worse. There are, of course, errors (peaks) that occurred even when generated using other equipment. These problems, however, do not diminish the quality of the DTM obtained from the Cartosat-1 stereocouple. Kaczynski R., Ziobro J., 1998. Digital Aerial Triangulation for DMT and Orthophoto Generation. International Archives of Photogrammetry and Remote Sensing, Vol.32, part 4, Stuttgart, pp. 281-283.


