The Effect of Spectral Unmixing of Hyperspectral Imagery for Mapping... C. Kobayashi *, O. Kashimura , T. Maruyama
advertisement

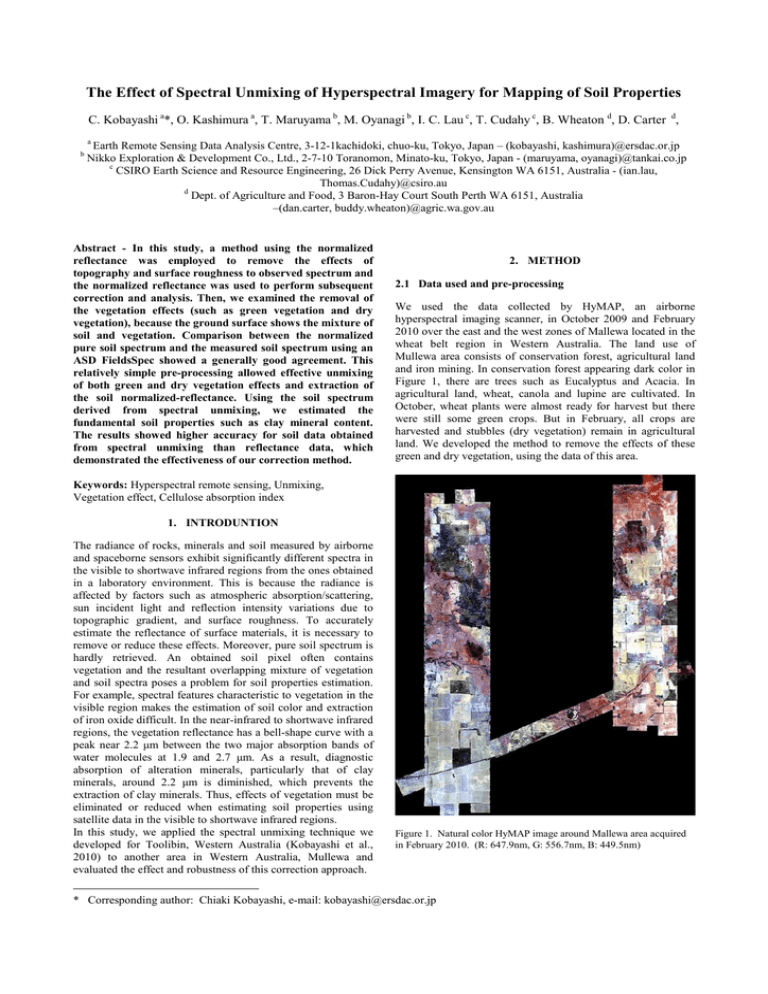
The Effect of Spectral Unmixing of Hyperspectral Imagery for Mapping of Soil Properties C. Kobayashi a*, O. Kashimura a, T. Maruyama b, M. Oyanagi b, I. C. Lau c, T. Cudahy c, B. Wheaton d, D. Carter d, a b Earth Remote Sensing Data Analysis Centre, 3-12-1kachidoki, chuo-ku, Tokyo, Japan – (kobayashi, kashimura)@ersdac.or.jp Nikko Exploration & Development Co., Ltd., 2-7-10 Toranomon, Minato-ku, Tokyo, Japan - (maruyama, oyanagi)@tankai.co.jp c CSIRO Earth Science and Resource Engineering, 26 Dick Perry Avenue, Kensington WA 6151, Australia - (ian.lau, Thomas.Cudahy)@csiro.au d Dept. of Agriculture and Food, 3 Baron-Hay Court South Perth WA 6151, Australia –(dan.carter, buddy.wheaton)@agric.wa.gov.au Abstract - In this study, a method using the normalized reflectance was employed to remove the effects of topography and surface roughness to observed spectrum and the normalized reflectance was used to perform subsequent correction and analysis. Then, we examined the removal of the vegetation effects (such as green vegetation and dry vegetation), because the ground surface shows the mixture of soil and vegetation. Comparison between the normalized pure soil spectrum and the measured soil spectrum using an ASD FieldsSpec showed a generally good agreement. This relatively simple pre-processing allowed effective unmixing of both green and dry vegetation effects and extraction of the soil normalized-reflectance. Using the soil spectrum derived from spectral unmixing, we estimated the fundamental soil properties such as clay mineral content. The results showed higher accuracy for soil data obtained from spectral unmixing than reflectance data, which demonstrated the effectiveness of our correction method. 2. METHOD 2.1 Data used and pre-processing We used the data collected by HyMAP, an airborne hyperspectral imaging scanner, in October 2009 and February 2010 over the east and the west zones of Mallewa located in the wheat belt region in Western Australia. The land use of Mullewa area consists of conservation forest, agricultural land and iron mining. In conservation forest appearing dark color in Figure 1, there are trees such as Eucalyptus and Acacia. In agricultural land, wheat, canola and lupine are cultivated. In October, wheat plants were almost ready for harvest but there were still some green crops. But in February, all crops are harvested and stubbles (dry vegetation) remain in agricultural land. We developed the method to remove the effects of these green and dry vegetation, using the data of this area. Keywords: Hyperspectral remote sensing, Unmixing, Vegetation effect, Cellulose absorption index 1. INTRODUNTION The radiance of rocks, minerals and soil measured by airborne and spaceborne sensors exhibit significantly different spectra in the visible to shortwave infrared regions from the ones obtained in a laboratory environment. This is because the radiance is affected by factors such as atmospheric absorption/scattering, sun incident light and reflection intensity variations due to topographic gradient, and surface roughness. To accurately estimate the reflectance of surface materials, it is necessary to remove or reduce these effects. Moreover, pure soil spectrum is hardly retrieved. An obtained soil pixel often contains vegetation and the resultant overlapping mixture of vegetation and soil spectra poses a problem for soil properties estimation. For example, spectral features characteristic to vegetation in the visible region makes the estimation of soil color and extraction of iron oxide difficult. In the near-infrared to shortwave infrared regions, the vegetation reflectance has a bell-shape curve with a peak near 2.2 µm between the two major absorption bands of water molecules at 1.9 and 2.7 µm. As a result, diagnostic absorption of alteration minerals, particularly that of clay minerals, around 2.2 µm is diminished, which prevents the extraction of clay minerals. Thus, effects of vegetation must be eliminated or reduced when estimating soil properties using satellite data in the visible to shortwave infrared regions. In this study, we applied the spectral unmixing technique we developed for Toolibin, Western Australia (Kobayashi et al., 2010) to another area in Western Australia, Mullewa and evaluated the effect and robustness of this correction approach. Figure 1. Natural color HyMAP image around Mallewa area acquired in February 2010. (R: 647.9nm, G: 556.7nm, B: 449.5nm) * Corresponding author: Chiaki Kobayashi, e-mail: kobayashi@ersdac.or.jp For HyMAP data, the wavelength between 450nm-2500nm was covered in 126 bands with spatial resolution of 4.2 m. HyMap radiance data were calibrated in the spectral direction for the shift of band central wavelength by CISRO. In the reflectance obtained by a radiation transfer code, partially-corrected water vapor absorptions near 0.94 and 1.14 µm and spikes due to CO2 absorption near 2 µm were observed. We used the ground truth reflectance data collected by FieldSpec at a time coincident to HyMAP overpasses and applied the Empirical Line Method (Conel et al., 1987, Roberts et al., 1986, Farrand et al., 1994) to obtain the accurate reflectance. 2.2 Normalized-reflectance The spectrum obtained from satellite/airborne remote sensing usually contains the effects of topography and surface roughness, and eliminating those effects is not an easy task. And also it is for this reason that accurate conversion of satellite data to reflectance spectra is difficult, because effects of topography or surface roughness are unavoidable even if appropriate atmospheric correction is applied. We therefore employed a correction technique in which each band is divided by the sum of all bands as with the average value in the spectral direction called the topographic factor used for the Log Residual method. This technique is a well-known method. Ono et al. (2002) divided each band using the average in the spectral direction and ERSDAC (2003) using the sum of bands. Furthermore, the normalized-reflectance method is insensitive to atmospheric effect (ERSDAC 2003, Ono et al., 2002, etc.). With this method, even when shadow is included in the measured spectrum, a similar normalized-reflectance profile can be obtained for the same material regardless of the incident light intensity, which means that the effects of shadow or terrain relief can be neglected with the use of normalized-reflectance. CAI is expressed as: CAI=0.5(N_MPRa + N_MPRc) - N_MPRb (1) Here, we used the normalized-reflectance at 2.01µm, 2.101µm and 2.206µm for N_MPRa, N_MPRb and N_MPRc, respectively. 2.4 Green vegetation removal However there are many methods to estimate the amount of vegetation using NDVI or SAVI for eliminating the green vegetation effect, correction of such effect in the dry vegetation (stubble) areas using NDVI or SAVI is difficult because reflectance ratio used for these indices changes due to dry vegetation. To address this problem, we employed a method which we investigated in Kobayashi et al., (2010) to use the absorption depth of water observed near 1200nm in vegetation. This correction method bases on the water absorption by vegetation near 1.2µm. This absorption is only observed for vegetation and not seen for soil or dry vegetation usually (Clevers et al. 2007,). In this method, the angle of reflectance at 1.114µm, 1.202µm and 1.244µm was used as an index to show green vegetation impact. Large green vegetation impact yields a sharp angle, while small impact produces an angle that approximates a straight line (180°) (Fig. 3). 2.3 Dry vegetation removal In this study, we focused on a characteristic absorption band of cellulose in the short-infrared region to examine the dry vegetation (fig. 2). Cellulose can be quantified by this diagnostic absorption band and the Cellulose Absorption Index (CAI) using this absorption band is proposed in Nagler et al., (2003). We applied this approach to the normalized-reflectance data and investigated the amount of dry vegetation cover according to the correction method revealed in Kobayashi et al. (2010) in detail. Figure 3. Water absorption in vegetation seen around 1.2µm As a result of a series of calculations, effects of green vegetation were removed and the normalized-reflectance of pure soil and was defined. 3. RESULT 3.1 Validation of the method to reduce vegetation effects Figure 2. Cellulose absorption We validated the results of the method to reduce vegetation effect using ASD FieldSpec data measured on the ground. An example of the correction results is shown in Figures 4 and 5 along with the field photo of the site in Figure 6. Normalized reflectance of observed spectrum of HyMAP data is shown in red color in Figure 4. Pure soil spectrum measured on the ground is shown in blue color. And estimated pure soil spectrum is shown in yellow color. Estimated spectrum profile corresponds with measured one, except for VNIR region (0.60.9µm) in which slight over-correction is shown. Based on the spectral form, this was attributed to the effects of iron oxide contained in some part of the soil. Especially at the wavelength over 2 µm where is important for mineral estimation, the profile of pure soil spectrum is well estimated, which demonstrates the effectiveness of the method to estimate the alteration minerals, clay minerals in particular (Fig.5). areas with abundant dry vegetation if surface soil is seen. In some cases, correction of vegetation effects was only partial. These cases were considered to be the areas densely covered with dry vegetation. 3.2 Estimation of soil property Figure 4. Estimated pure soil spectrum (yellow) and measured pure soil spectrum (blue). Uncorrected spectrum is shown in red. Clay minerals were estimated using the corrected normalizedreflectance. Total clay content data were available from the field sampling in Mullewa in February 2010, and we examined the correlation between the absorption depth at 2200nm and clay content in this study. Figure 8 displays the relationship between total clay content and the absorption depth at 2200nm both of the corrected and the uncorrected data. Comparison of these results demonstrated the effectiveness of the method using the normalized-reflectance by green and dry vegetation corrections. The coefficient of determination of the clay mineral estimation using the data before unmixing was very low (R2=0.00453) but the value significantly improved after unmixing (R2=0.5508). Figure7 shows the clay mineral content map of east zone of Mullewa created using the correlation equation in Figure 7, which illustrates that the total clay mineral content underestimated before unmixing due to ground vegetation was accurately estimated after correction. Figure 5. Normalized reflectance in the wavelength over 1.9µm Figure 6. Field photo of the ground measurement site We assessed the reliability of our method using the data acquired in the other season that show different surface vegetation conditions. Data used were HyMap data collected in October 2009, which cover the same region as the February 2010 dataset. Comparison with the ASD FieldSpec ground measurements showed that the effects of vegetation were also corrected properly in the October pre-harvest data having much dry vegetation, indicating the applicability to this approach to Figure 7. Total clay mineral content map Left image is the estimation result using uncorrected data. Right image is the estimation result using corrected data. of ground reflectance,” Proceedings of the Third Airborne Imaging Spectrometer Data Analysis Workshop, JPL Publication 87-30, P.18-47, 1987. ERSDAC, “Remote sensing application for development of extracting method of high potential resource area from ASTER TIR data,” Report on Research and Development of Remote Sensing Technology for Non-renewable Resources, (3/4). Tokyo, JAPAN, 2003. Farrand W. H., Singer R. B., and Merenyi E., “Retrieval of Apparent surface reflectance from AVIRIS Data: A Comparison of Empirical Line, Radiative transfer, and Spectral mixture Methods,” Remote Sensing and Environment, Vol. 47, P.311321, 1994. Figure 8. Relationship between total clay content and the absorption depth at 2200nm. Left (blue color): Uncorrected data, Right (red color): Corrected data 4. CONCLUSION We proposed here a method to extract information using the normalized-reflectance. This method is not affected by topographic relief, shadow, or soil/vegetation brightness. And extracted spectrum profile of pure soil corresponds with observed spectrum. While an accurate correction was achieved especially at the wavelength over 2µm, which is an important wavelength range for extracting the alteration minerals, overcorrection was observed in the 0.6-0.9µm in the VNIR region. Development of a method that maintains high correction accuracy in the areas with dense vegetation cover and avoids over-correction will be the subject of our future research. This method assumed that each of green and dry vegetation in the study area was represented by a respective single normalized-reflectance profile. However, plant species vary by region and the normalized-reflectance of vegetation changes to a certain degree. This variance leads to the estimation error in determining the soil normalized-reflectance. Whether this error is within the acceptable range or not in estimating the soil properties needs to be investigated in the future. The normalized-reflectance of pure soil can be estimated from the impact of green vegetation and dry vegetation normalizedreflectance if they are estimated accurately. The reflectance shows some variation in reality even for homogenous vegetation areas, and the estimated soil normalized-reflectance becomes inaccurate in the case of increased vegetation cover. This error should also be examined to determine the upper limit for the soil normalized-reflectance estimation. REFERENCE Clevers J. G. P. W., L.Kooistra and M.E. Schaepman, “Canopy water content retrieval from hyperspectral remote sensing,” Proceedings of the 10th International Symposium on Physical Measurements and Spectral Signatures in Remote Sensing (ISPMSRS'07), Davos (CH), 2007. Conel J. E., Green R. O., Vane G., Brugge C. J. and Alley R. E., “AIS-2 radiometry and a comparison of method for the recovery Green A. A., and Craig M. D., “Analysis of aircraft spectrometer data with logarithmic residuals,” Proceedings of the Airborne Imaging Spectrometer Data Analysis Workshop, JPL Publication 85-41, P. 111-119, 1985. Kobayashi C., Kashimura O., Maruyama T., Oyanagi M., Lau I. C., Cudahy T., Wheaton B., and Cater D., “Method to Reduce Green and Dry vegetation Effects for Soil Mapping Using Hyperspectral Data,” International Archives of the Photogrammetry, Remote Sensing and Spacial Information Science, Vol. XXXVIII, Part 8, P. 448-453, 2010. Kruse F. A., “Use of Airborne imaging Spectrometer Data to Map Minerals Associated with Hydrothermally Altered Rocks in the Northern Grapevine Mountains, Nevada, and California,” Remote Sensing and Environment, Vol. 24, P.31-51, 1988. Nagler P. L., Inoue Y., Glenn E. P., Russ A. L. and Daughtry C. S. T., “Cellulose Absorption Index (CAI) to quantify mixed soil-plant litter scenes,” Remote Sensing of Environment, 87 pp.310-325, 2003. Ono A., Fujiwara N. and Ono A., “Suppression of Topographic and Atmospheric Effects by Normalizing the Radiation Spectrum of Landsat/TM by the Sum of Each Band,” Journal of the remote sensing society of Japan (in Japanese with English abstract), 22 (3) pp.318-327, 2002. Roberts D. A., Yamaguchi Y., and Ryon R. J. P., “Comparison of Various Techniques for calibration of AIS Data,” Proceedings of the Second Airborne Imaging Spectrometer Data Analysis Workshop, JPL Publication 86-35, P. 21-30, 1986. ACKNOWWLEDGEMENTS We are grateful to all colleagues who assisted the field survey at the Mullewa area of WA in Australia from February to March 2010.


