PHAVEOS: The PHenology And Vegetation EO Service T.H.G.Lankester , J.Dash
advertisement

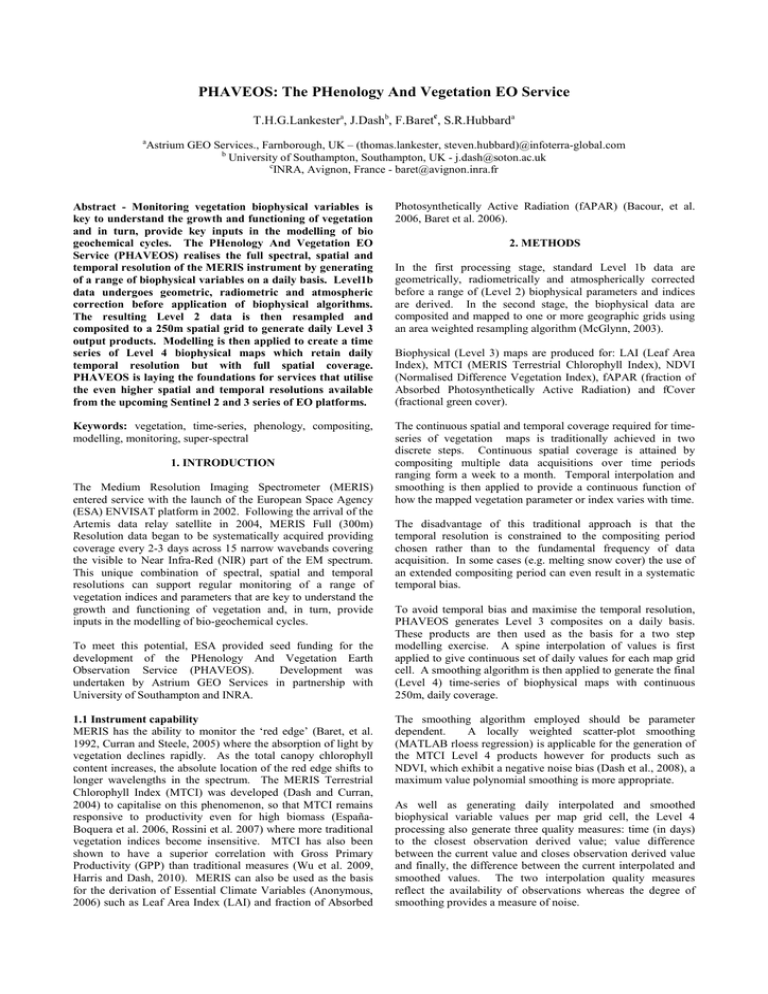
PHAVEOS: The PHenology And Vegetation EO Service T.H.G.Lankestera, J.Dashb, F.Baretc, S.R.Hubbarda a Astrium GEO Services., Farnborough, UK – (thomas.lankester, steven.hubbard)@infoterra-global.com b University of Southampton, Southampton, UK - j.dash@soton.ac.uk c INRA, Avignon, France - baret@avignon.inra.fr Abstract - Monitoring vegetation biophysical variables is key to understand the growth and functioning of vegetation and in turn, provide key inputs in the modelling of bio geochemical cycles. The PHenology And Vegetation EO Service (PHAVEOS) realises the full spectral, spatial and temporal resolution of the MERIS instrument by generating of a range of biophysical variables on a daily basis. Level1b data undergoes geometric, radiometric and atmospheric correction before application of biophysical algorithms. The resulting Level 2 data is then resampled and composited to a 250m spatial grid to generate daily Level 3 output products. Modelling is then applied to create a time series of Level 4 biophysical maps which retain daily temporal resolution but with full spatial coverage. PHAVEOS is laying the foundations for services that utilise the even higher spatial and temporal resolutions available from the upcoming Sentinel 2 and 3 series of EO platforms. Keywords: vegetation, time-series, phenology, compositing, modelling, monitoring, super-spectral 1. INTRODUCTION The Medium Resolution Imaging Spectrometer (MERIS) entered service with the launch of the European Space Agency (ESA) ENVISAT platform in 2002. Following the arrival of the Artemis data relay satellite in 2004, MERIS Full (300m) Resolution data began to be systematically acquired providing coverage every 2-3 days across 15 narrow wavebands covering the visible to Near Infra-Red (NIR) part of the EM spectrum. This unique combination of spectral, spatial and temporal resolutions can support regular monitoring of a range of vegetation indices and parameters that are key to understand the growth and functioning of vegetation and, in turn, provide inputs in the modelling of bio-geochemical cycles. To meet this potential, ESA provided seed funding for the development of the PHenology And Vegetation Earth Observation Service (PHAVEOS). Development was undertaken by Astrium GEO Services in partnership with University of Southampton and INRA. 1.1 Instrument capability MERIS has the ability to monitor the ‘red edge’ (Baret, et al. 1992, Curran and Steele, 2005) where the absorption of light by vegetation declines rapidly. As the total canopy chlorophyll content increases, the absolute location of the red edge shifts to longer wavelengths in the spectrum. The MERIS Terrestrial Chlorophyll Index (MTCI) was developed (Dash and Curran, 2004) to capitalise on this phenomenon, so that MTCI remains responsive to productivity even for high biomass (EspañaBoquera et al. 2006, Rossini et al. 2007) where more traditional vegetation indices become insensitive. MTCI has also been shown to have a superior correlation with Gross Primary Productivity (GPP) than traditional measures (Wu et al. 2009, Harris and Dash, 2010). MERIS can also be used as the basis for the derivation of Essential Climate Variables (Anonymous, 2006) such as Leaf Area Index (LAI) and fraction of Absorbed Photosynthetically Active Radiation (fAPAR) (Bacour, et al. 2006, Baret et al. 2006). 2. METHODS In the first processing stage, standard Level 1b data are geometrically, radiometrically and atmospherically corrected before a range of (Level 2) biophysical parameters and indices are derived. In the second stage, the biophysical data are composited and mapped to one or more geographic grids using an area weighted resampling algorithm (McGlynn, 2003). Biophysical (Level 3) maps are produced for: LAI (Leaf Area Index), MTCI (MERIS Terrestrial Chlorophyll Index), NDVI (Normalised Difference Vegetation Index), fAPAR (fraction of Absorbed Photosynthetically Active Radiation) and fCover (fractional green cover). The continuous spatial and temporal coverage required for timeseries of vegetation maps is traditionally achieved in two discrete steps. Continuous spatial coverage is attained by compositing multiple data acquisitions over time periods ranging form a week to a month. Temporal interpolation and smoothing is then applied to provide a continuous function of how the mapped vegetation parameter or index varies with time. The disadvantage of this traditional approach is that the temporal resolution is constrained to the compositing period chosen rather than to the fundamental frequency of data acquisition. In some cases (e.g. melting snow cover) the use of an extended compositing period can even result in a systematic temporal bias. To avoid temporal bias and maximise the temporal resolution, PHAVEOS generates Level 3 composites on a daily basis. These products are then used as the basis for a two step modelling exercise. A spine interpolation of values is first applied to give continuous set of daily values for each map grid cell. A smoothing algorithm is then applied to generate the final (Level 4) time-series of biophysical maps with continuous 250m, daily coverage. The smoothing algorithm employed should be parameter dependent. A locally weighted scatter-plot smoothing (MATLAB rloess regression) is applicable for the generation of the MTCI Level 4 products however for products such as NDVI, which exhibit a negative noise bias (Dash et al., 2008), a maximum value polynomial smoothing is more appropriate. As well as generating daily interpolated and smoothed biophysical variable values per map grid cell, the Level 4 processing also generate three quality measures: time (in days) to the closest observation derived value; value difference between the current value and closes observation derived value and finally, the difference between the current interpolated and smoothed values. The two interpolation quality measures reflect the availability of observations whereas the degree of smoothing provides a measure of noise. 3. RESULTS AND APPLICATIONS Sample Level 3 and Level 4 PHAVEOS products are illustrated in Figures 1, 2 and 3. Figure 3. 2009 interpolated (blue) and smoothed (red) MTCI values for the oak woodland grid map cell outlined in Figure 2. Figure 1. Level 3 (composite) map of fractional green cover across Ireland for 14th January 2006. The 250m spatial grid used for the PHAVEOS vegetation maps is best appreciated in Figure 2. Service development has been carried out with a number of user partners in the UK and Ireland leading to the identification of a range of potential applications. PHAVEOS has already demonstrated its worth for public education and engagement by providing dynamic maps showing the dramatic difference between the Spring greening events of 2009 and 2010 across the British Isles (Nature’s Calendar, 2010). For forestry, canopy and woodland health mapping, forest damage identification and monitoring, and determination of growing season length are all areas for further investigation. In nature conservation, the service could assist with landscape-scale ecosystem assessment and habitat surveillance, more specifically evaluating how phenological information may help with distinguishing specific habitat types otherwise difficult to distinguish from conventional optical EO approaches. Work is also on-going to adapt, from MODIS to MERIS, the approach of van der Wal (2010) for the use of medium resolution (250 m pixel) imagery to detect phenological changes occurring on the intertidal areas. For all of these applications there is a basic need to characterise both data availability and the ability to detect natural changes and distinguish them from the effects of instrument, atmospheric and processing induced noise. This requirements applies to each of the vegetation parameters and indices produced by PHAVEOS. 4. CHARACTERISATION AND VALIDATION The availability of PHAVEOS products will be characterised spatially and temporally by generating maps of the percentage of data availability over a 6 year time span from 2005-2010. An example of such map is provide in Figure 4, which illustrates that data coverage in the northwest is relatively low (less than 10%) compared to the southern part of the British Isles. For areas having good data coverage, the reliability of the products will be provided for key phenological stages such as during spring and autumn. This will be done using a temporal moving window to identify temporal gaps during these key seasons. Figure 2. fCover map for 19th March 2009, superimposed over orthorectified aerial photography of Alice Holt Forest, UK Derived from MERIS data acquired in early Spring 2009, prior to bud-burst, the forest area in the centre of Figure 2 exhibits a lower fractional green cover than the golf course located to the north (top centre of Figure 2). To illustrate phenology dynamics the modelled (Level 4) results for a single map cell can be plotted through time (see Figure 3). To assist with the understanding and interpretation of the high temporal resolution Level 4 time series, the time series will be characterised by two measures of noise: (i) the change in observation derived biophysical variables per day; (ii) the smoothed value / difference between the smoothed and interpolation values. The first measure contains a degree of natural signal variation whereas the second measure attempts to remove and normalises for the signal, yielding a measure of signal to noise ratio (SNR). In parallel with the basic characterisation of PHAVEOS time series, work will be carried out in to relation to ground based measurements to provide a better understanding of land surface processes. Broadly three types of data can be used to validate outputs from PHAVEOS: (i) ground observations; (ii) high spatial resolution satellite data; (iii) digital camera images (from ‘phenocam’) obtained at very high (30 minute) temporal resolution. Where possible, biophysical products derived from PHAVEOS will be compared with ground measurements obtained at different time of the growing season. Then the standard error of prediction (variation of PHAVEOS output with respect to the ground data over a week) of the biophysical products will be determined as a measure of accuracy of the product. For woodland sites at Alice Holt Forest and Wytham Wood in the UK, one year of phenocam data will be used to derive annual time series of reflectance in red, green and blue. These time series will be then compared with the PHAVEOS derived daily time series of reflectance in red, green and blue bands. Figure4. Illustrative data availability for 2008. 5. CONCLUSIONS By making spatially and temporally continuous time series of a number of vegetation variable available, PHAVEOS is enabling the investigation of operational utilisation of super-spectral EO data. This on-going investigation to characterise and validate these products will lead to a targeted market development with applications ranging from intertidal monitoring, land use change detection, inventory of forest health and productivity, to support for ecosystem / biodiversity assessment. With 300m resolution MERIS data available from July 2004, PHAVEOS is developing a multi-year set of time series that will act as a baseline for continued service development based on the Ocean and Land Colour Instrument (OCLI) due to be deployed with the launch of the first upcoming Sentinel 3 platform in 2013. The techniques and applications developed with MERIS data will also form the basis for an expansion of PHAVEOS to new applications that utilise the 20m resolution of the Sentinel-2 Multi-Spectral Imager (MSI). REFERENCES Anonymous, 2006. GCOS-107 (WMO/TD No. 1338) “Supplemental details to the satellite based component of the Implementation Plan for the Global Observing System for Climate in Support of the UNFCCC" Geneve , Switzerland, http://www.wmo.int/pages/prog/gcos/Publications/gcos-107.pdf C. Bacour, F. Baret, et al., “Neural network estimation of LAI, fAPAR, fCover and LAIxCab, from top of canopy MERIS reflectance data: principles and validation”, Remote Sensing of Environment 105, p.p. 313-325, 2006 F. Baret, S. Jacquemoud, G. Guyot, C. Leprieur, "Modeled analysis of the biophysical nature of spectral shifts and comparison with information content of broad bands. Remote Sensing of the Environment, 41, p.p. 133-142., 1992 Baret, F. Pavageau, K., Beal, D., Weiss, M., Berthelot, B. and Regner, P., 2006. “Algorithm Theoretical Basis Document for MERIS Top of Atmosphere Land Products (TOA_VEG) Version 3” Report of ESA contract AO/1-4233/02/I-LG, http://www.brockmannconsult.de/beam/software/repositories/4.6/beam-meris-veg2.0.1/docs/MERIS_ATBD_TOA_VEG_03_06.pdf Baret, F., Weiss, M., Garrigues, S., 2008. In WGCV-29, Session 4: Land Product Validation Special Session, INRA / CNES, Avignon, France. “OLIVE On Line Interactive Validation Exercise” http://www.ceos.org/images/wgcv/wgcv29/OLIVEPARaMETER_Baret.pdf Baret, F., Billard, G., Marloie1, O., Hanocq1, J.F., de Solan, B., A. Labouret, A., 2010. CEOS LPV Phenology focus group, “PAR@METER: a wireless system for fAPAR and LAI continuous monitoring.” http://lpvs.gsfc.nasa.gov/PDF/PAR@METER.pdf P. J. Curran and C. M. Steele, “MERIS: The re-branding of an ocean sensor”, International Journal of Remote Sensing, 26, p.p. 1781-1798, 2005 J. Dash and P. J. Curran,. “The MERIS terrestrial chlorophyll index”. International Journal of Remote Sensing, 25, p.p. 54035413, 2004 J. Dash, J. Rumsey, T.H.G. Lankester, S.R. Hubbard and P.J. Curran, “A comparison of two phenological variables derived from VEGETATION NDVI and MERIS MTCI: A feasibility study in the context of Global Monitoring for Environment and Security (GMES)”. 37th COSPAR Scientific Assembly. Montréal, Canada., p.p.646, July 2008 L.M. Espana-Boquera, R. Cardenas-Navarro, L. Lopez-Perez, V. Castellanos-Morales and LOBIT, P. Lobit, “Estimating the nitrogen concentration of strawberry plants from its spectral response”, Communications in Soil Science and Plant Analysis, 37, p.p. 2447-2459, 2006 A. Harris and J. Dash, “An evaluation of the MERIS Terrestrial Chlorophyll Index for direct estimation of carbon fluxes”, Remote Sensing of Environment, 114, p.p. 1856-1862, 2010 McGlynn, T.A. 2003. In AAS 201st Meeting, Session. 91.05 “A fast flux-conserving resampling algorithm”, Seattle, WA, USA, http://aas.org/archives/BAAS/v34n4/aas201/895.htm?q=publica tions/baas/v34n4/aas201/895.htm Nature’s Calendar “Spring from outer space – June update” http://www.naturescalendar.org.uk/findings/spring_from_outer_ space_june_update.htm D. van der Wal, A. Wielemaker-van den Dool and P.M.J. Herman,.” Spatial synchrony in intertidal benthic algal biomass in temperate coastal and estuarine ecosystems”. Ecosystems, 13 p.p. 338-351, 2010 C.Y.Wu, Z.Niu, Q.Tang, W.J.Huang, B.Rivard and J.L.Feng, “Remote estimation of gross primary production in wheat using chlorophyll-related vegetation indices”, Agricultural and Forest Meteorology, 149, p.p. 1015-1021, 2009 ACKNOWLGEMENTS The authors would like to acknowledge the support of the ESA EODM programme which funded the PHAVEOS development, supplied data and generously donated access to the Grid Processing On-Demand (G-POD) data processing infrastructure. In particular, we would like to acknowledge the advice, guidance and encouragement provided by Dr B.Koetz, the ESA project officer.


