An Economic Framework for Evaluating “Climate Proofing” Investments on Infrastructure
advertisement

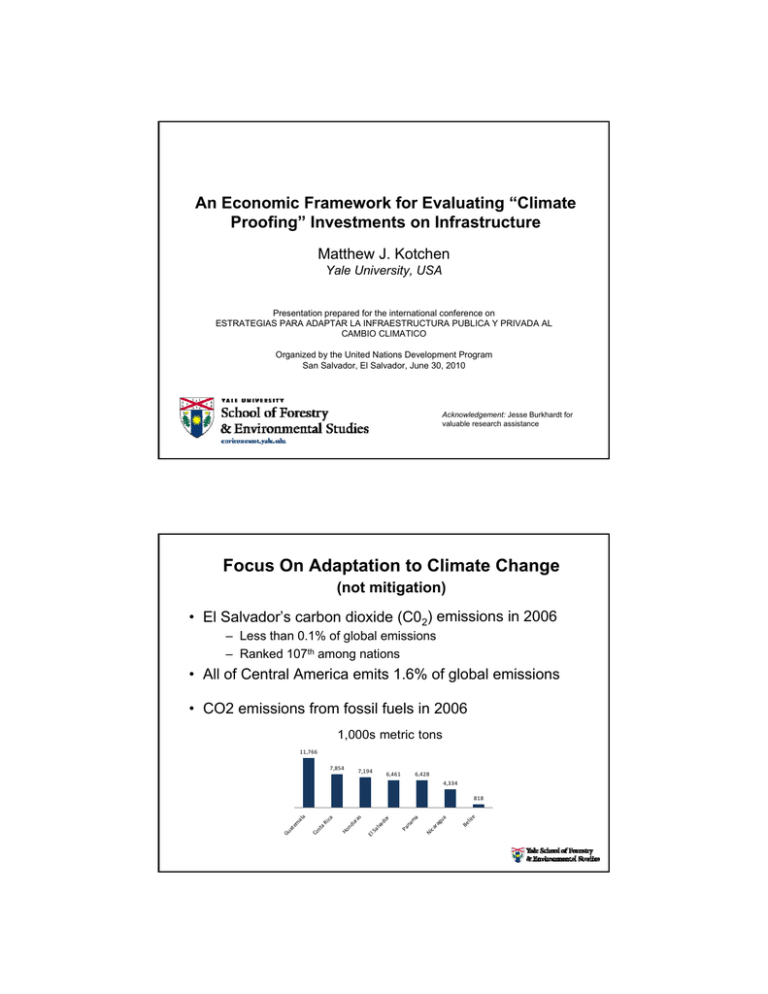
An Economic Framework for Evaluating “Climate Proofing” Investments on Infrastructure Matthew J. Kotchen Yale University, USA Presentation prepared for the international conference on ESTRATEGIAS PARA ADAPTAR LA INFRAESTRUCTURA PUBLICA Y PRIVADA AL CAMBIO CLIMATICO Organized by the United Nations Development Program San Salvador, El Salvador, June 30, 2010 Acknowledgement: Jesse Burkhardt for valuable research assistance Focus On Adaptation to Climate Change (not mitigation) • El Salvador’s carbon dioxide (C02) emissions in 2006 – Less than 0.1% of global emissions – Ranked 107th among nations • All of Central America emits 1.6% of global emissions • CO2 emissions from fossil fuels in 2006 1,000s metric tons 11,766 7,854 7,194 6,461 6,428 4,334 ize Be l Ni ca ra gu a Pa na m a or lva d El Sa ica Ho nd ur as Co st a R Gu at em al a 818 Climate-Change Impacts on El Salvador (SICA 2008) • Temperature increases – 2020 between 0.8°C and 1.1°C – 2100 between 2.5°C and 3.7°C • Changes in precipitation – 2020 between -11.3% and 3.5% – 2100 between -36.6% and 11.1% • Sea-level increase How to better prepare? – 20cm by 2030 – 40cm by 2040 – 70cm by 2100 Outline of Presentation • Economic valuation of infrastructure climate proofing – Costs and benefits – Market and nonmarket valuation • A framework for decision-making – How to set priorities given finite resources • Further considerations – – – – Co-benefits Geographic scope Proofing vs. prioritizing infrastructure projects Discounting • Building capacity for efficient climate-change adaptation • Final thoughts The Costs of Climate Proofing Infrastructure Climate proofing • Insuring against adverse climate change impacts • Effectiveness b/w 0% – 100% $ MC Requirements • Climate/weather forecasts • Engineering inputs • Market valuation Notation • MC = marginal costs • TC = total costs TC 0% Q Climate proofing 100% The Benefits of Climate Proofing Infrastructure Benefits are avoided damages • Property • Economic activity • Health & human life • Environmental services $ MSB Requirements • Non-market valuation • Social vs. private perspective Notation • MSB = marginal social benefits • TSB = total social benefits TSB 0% Q Climate proofing 100% The Example of Tropical Storms Selected significant impacts in El Salvador Forecasted impacts in Central America (Mendelsohn et al. 2010) • Hurricane Mitch (1998) – Destroyed 49% of agricultural and livestock sectors – Direct fatalities 240 – Damage estimate $400 million • Hurricane Stan (2005) – Destroyed 70% basic crops – Direct fatalities 69 – Damage estimate $355 million • Climate models predict an increase in storm frequency and intensity Damages relative to no climate-change baseline 2100 (million $/year) Notation • NSB = net social benefit • Q* = efficient level of climate proofing $ MC MSB 0% Q* Climate proofing 100% la em a at ma na Economically Efficient Climate Proofing Gu ca R i sta Co Pa e l iz Be a gu ra ca do r Sa lva ur a El nd Ho Ni s 600 500 400 300 200 100 0 ‐100 Economically Efficient Climate Proofing Notation • NSB = net social benefit • Q* = efficient level of climate proofing $ MC MSB TC Q* 0% 100% Climate proofing Economically Efficient Climate Proofing Notation • NSB = net social benefit • Q* = efficient level of climate proofing $ MC MSB TSB 0% Q* Climate proofing 100% Economically Efficient Climate Proofing Notation • NSB = net social benefit • Q* = efficient level of climate proofing $ MC MSB NSB Q* 0% 100% Climate proofing Economically Efficient Climate Proofing Notation • NSB = net social benefit • Q* = efficient level of climate proofing $ Notation • MNSB = marginal net social benefit • Q* = efficient level of climate proofing $ MC MSB MNSB (= MSB – MC) NSB NSB 0% Q* Climate proofing 100% 0% Q* Climate proofing 100% Prioritizing Among Projects with a Fixed Budget Project A Project B $ $ MNSBA MNSBB Q*A 0% 100% Q*B 100% 0% Prioritizing Among Projects with a Fixed Budget Objective is to maximize total net social benefits subject to the budget constraint Project A Project B $ $ MNSBA MNSBB 0% Q’A Q*A 100% 0% Q’B Solution is MNSBA = MNSBB where cost of Q’A and Q’B = Budget Q*B 100% Prioritizing Among Projects with a Fixed Budget Objective is to maximize total net social benefits subject to the budget constraint Project A Project B $ $ MNSBA MNSBB NSBA 0% NSBB Q’A Q*A 100% 0% Q’B Q*B 100% Solution is MNSBA = MNSBB where costs of Q’A and Q’B exhaust Budget Implications of Framework • Framework requires marginal social net benefits of projects – Marginal costs • Engineering inputs • Education and retraining • Market valuation – Marginal social benefits • Nonmarket valuation • Choose projects with greatest social net benefits – Extensive margin: which ones? – Intensive margin: how much? Importance of Climate-Proofing Externalities • Projects may be associated with valuable co-benefits – Infrastructure for flood control can provide water storage – Vegetation prevents landslides and promotes biodiversity (also opportunity for carbon offset payments) • Infrastructure often closely tied with networks – Transportation, communication, electricity distribution, etc. – Spillover benefits across jurisdictional boundaries Departamentos de El Salvador Prioritizing Among Projects Accounting for Externality Project A Project B $ $ MNSBB MNSBA 0% Q’A Q*A 100% 0% Q’B Q*B 100% Prioritizing Among Projects Accounting for Externality Project A Project B $ $ MNSBB + externality MNSBA 0% Q*A Q’A 100% 0% Q*B 100% Q’B Prioritizing Among Projects Accounting for Externality Project A Project B $ $ MNSBB + externality MNSBA 0% Q’A Q’A Q*A 100% 0% Q’B Q’B Q*B 100% Prioritizing Among Projects Accounting for Externality Project A Project B $ $ MNSBB + externality MNSBA 0% Q*A Q’A Q’A 100% 0% Q’B Q’B Q*B 100% Prioritizing Among Projects Accounting for Externality Project A Project B $ $ MNSBB + externality MNSBA 0% Q’A Q’A Q*A 100% 0% Q’B Q’B Q*B 100% Further Considerations • Proofing vs. prioritizing infrastructure projects – Thus far discussed efficient proofing given infrastructure priorities – Framework generalizes to optimal infrastructure priorities accounting for climate-change impacts – Priorities may change: e.g., estimated land loss due to sea-level rise between 10% and 27.6% land area (IPCC 2007) • Discounting is the way to account for differences in the timing of costs and benefits – – – – Higher discount rates imply less value placed on the future Developing vs. developed nation differences? Implications for inter-generational equity What about intra-generational equity? Building Capacity for Efficient Climate-Change Adaptation • Identify the universe of potential infrastructural adaptations – Worldwide and region specific – Summary of success and failures • Expand knowledge base of nonmarket values – More research in developing nations – Improved data availability for “benefits transfer” – e.g., Canada’s Environmental Valuation Reference Inventory (EVRI): North America (1,178 studies), Asia (229 studies), Latin America (38 studies) • Construct a parallel approach for costs of climate proofing • Strengthen institutions for greater international and regional coordination of efforts Human Capital to Institutional Support • Geographic information systems to identify vulnerabilities – Geophysical information – Socioeconomic information – Inter-connectedness • Census data is important • Data collection during storm events – Impacts? – Responses? • Training in microeconomic theory – Welfare economics – Nonmarket valuation • Training in quantitative statistical methods • On-going program evaluation Concluding Thoughts • The role of public policy – Intervention when public goods and externalities – Reduce distortions in private markets (e.g., information disclosure) • Remember to consider what should not be done – Infrastructure somewhat permanent or irreversible – Reduce “regrettable” decisions • Types of policies – Direct regulation – Price signals as incentives • Economic development among the most important adaptation strategies – Caution against focusing exclusively on most vulnerable (poorest) – Dividends from adaptation that promotes development


