The Winning 3-Pointer Reflect and Apply
advertisement
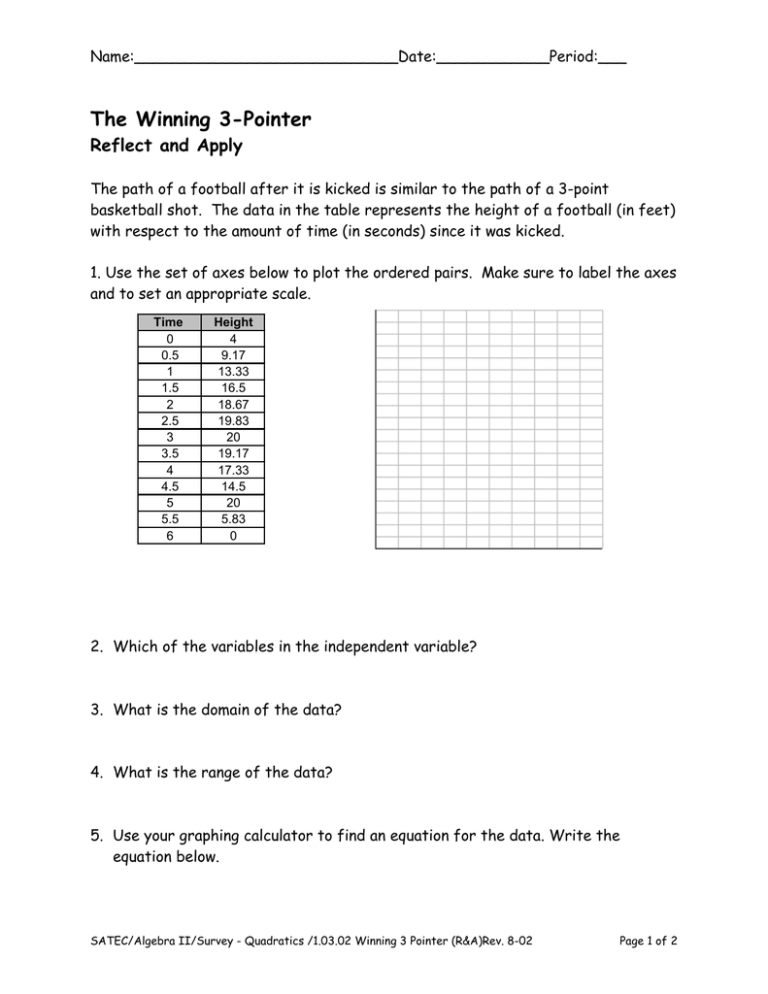
Name:____________________________Date:____________Period:___ The Winning 3-Pointer Reflect and Apply The path of a football after it is kicked is similar to the path of a 3-point basketball shot. The data in the table represents the height of a football (in feet) with respect to the amount of time (in seconds) since it was kicked. 1. Use the set of axes below to plot the ordered pairs. Make sure to label the axes and to set an appropriate scale. Time 0 0.5 1 1.5 2 2.5 3 3.5 4 4.5 5 5.5 6 Height 4 9.17 13.33 16.5 18.67 19.83 20 19.17 17.33 14.5 20 5.83 0 2. Which of the variables in the independent variable? 3. What is the domain of the data? 4. What is the range of the data? 5. Use your graphing calculator to find an equation for the data. Write the equation below. SATEC/Algebra II/Survey - Quadratics /1.03.02 Winning 3 Pointer (R&A)Rev. 8-02 Page 1 of 2 6. What is a reasonable domain for the situation? 7. What is a reasonable range for the situation? 8. What is the height of the football after 4.25 seconds? Show your process. 9. When does the football hit the ground? How do you know? 10. From what initial height was the football kicked? How do you know? SATEC/Algebra I/Foundations of Functions /1.03.02 Winning 3 Pointer (R&A)Rev. 07-01 Page 2 of 2
