Kevin Christ Associate Professor of Economics Rose-Hulman Institute of Technology
advertisement
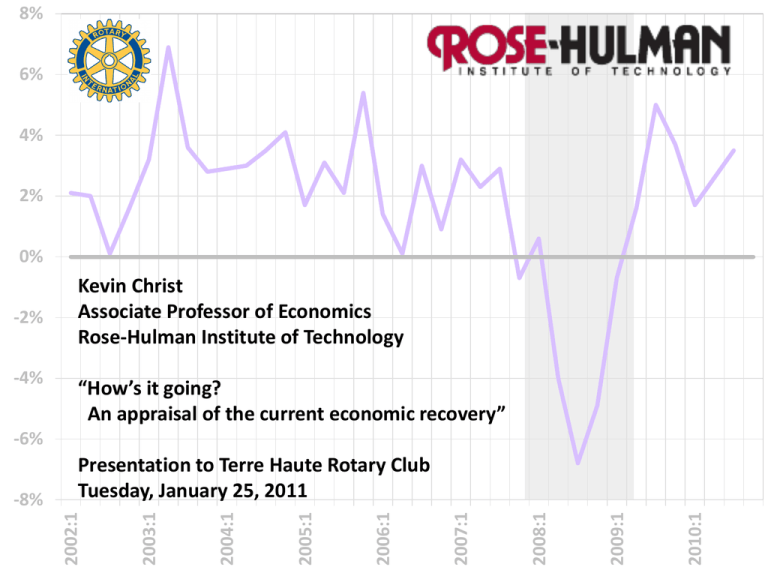
8% 6% 4% 2% 0% -2% -4% Kevin Christ Associate Professor of Economics Rose-Hulman Institute of Technology “How’s it going? An appraisal of the current economic recovery” -6% 2010:1 2009:1 2008:1 2007:1 2006:1 2005:1 2004:1 2003:1 2002:1 -8% Presentation to Terre Haute Rotary Club Tuesday, January 25, 2011 2010:1 2009:1 2008:1 2007:1 2006:1 2005:1 2004:1 2003:1 2002:1 8% 6% 4% 2% 0% -2% -4% -6% Annual Growth Rate of GDP -8% Why Is the Recovery Proceeding So Slowly? Percent Job Losses Relative to Peak Employment Month Comparing Post-War Recessions: Percent Job Losses During Recession and Recovery 1948 1982 1990 Number of Months After Peak Employment Source: http://www.calculatedriskblog.com 2001 Why the Unemployment Rate Is Likely to Still be 8% in December 2011 DURATE = 1.32 - .44DGDP Early 1984 Why Is the Recovery Proceeding So Slowly? Comparing Three Deep Post-War Recessions: Recovery of Personal Consumption Expenditures Annual Growth Rate of Personal Consumption Expenditures 8% 6% 1982 – 1984 4% 2% 1974 – 1976 0% 2008 – 2010 -2% Recession Recovery -4% 1 2 3 4 5 6 7 8 9 10 11 12 Quarters Since the Beginning of the Recession Light dotted lines correspond to the 1990 and 2001 recessions, which were both relatively mild. Why Is the Recovery Proceeding So Slowly? Comparing Three Deep Post-War Recessions: Recovery of Durable Goods Expenditures Annual Growth Rate of Durable Goods Expenditures 25% 20% 1982 – 1984 15% 1974 – 1976 10% 5% 0% -5% 2008 – 2010 -10% Recession Recovery -15% 1 2 3 4 5 6 7 8 9 10 11 12 Quarters Since the Beginning of the Recession Light dotted lines correspond to the 1990 and 2001 recessions, which were both relatively mild. What Started All of This Anyway? 140% Household Debt as a Percent of Disposable Personal Income Late Summer 2007 120% 100% 80% 60% 40% 20% Mortgage Debt Other Household Debt 2010:Q1 2005:Q1 2000:Q1 1995:Q1 1990:Q1 1985:Q1 1980:Q1 1975:Q1 1970:Q1 1965:Q1 1960:Q1 0% What Started All of This Anyway? House Prices: The Case-Shiller House Price Index 250 June/July 2006 200 150 100 2010 2009 2008 2007 2006 2005 2004 2003 2002 2001 2000 1999 1998 1997 1996 1995 1994 1993 1992 1991 1990 1989 1988 0 1987 50 Why Didn’t Anyone See This Coming? (Some Did) "I believe we're going to have two years of negative economic growth. The last two recessions lasted only eight months each ... This time around this is going to be three times as long, three times as deep. This is going to be the worst recession the US has experienced since the 1980s." Nouriel Roubini September 7, 2006 Why Didn’t Anyone See This Coming? (Some Did) August 25, 2006 OP-ED COLUMNIST Housing Gets Ugly By PAUL KRUGMAN ... Housing has been the main engine of U.S. economic growth over the past three years, and with that engine now going into reverse, it’s hard to see how we can avoid a serious slowdown. Why Didn’t Anyone See This Coming? (Some Did) August 8, 2005 OP-ED COLUMNIST That Hissing Sound By PAUL KRUGMAN This is the way the bubble ends: not with a pop, but with a hiss … the news that the U.S. housing bubble is over won't come in the form of plunging prices; it will come in the form of falling sales and rising inventory, as sellers try to get prices that buyers are no longer willing to pay. And the process may already have started … we're starting to hear a hissing sound, as the air begins to leak out of the bubble. And everyone should be worried. Why Didn’t Anyone See This Coming? (Some Did) “… the most important concern is whether banks will be able to provide liquidity to financial market so that if the tail risk does materialize, financial positions can be unwound and losses allocated so that the consequences to the real economy are minimized … trends suggest that even though there are far more participants today able to absorb risk, the financial risks that are being created by the system are indeed greater." Raghuram Rajan Jackson Hole August 26, 2005 A Debt Hangover? Mian and Sufi, Federal Reserve Bank of San Francisco, January 18, 2011: “Overall, the evidence strongly suggests that credit demand is weak because of an overleveraged household sector. This view is supported by survey evidence that the main worry of businesses is sales, not financing … The evidence is more consistent with the view that problems related to household balance sheets and house prices are the primary culprits of the weak economic recovery.” 2010:1 2005:1 2000:1 1995:1 1990:1 1985:1 1980:1 12% 1975:1 1970:1 Personal Savings as a Percent of Personal Disposable Income Why Are Things Different This Time? A Dramatic Change in U.S. Saving Behavior 10% 8% 6% 4% 2% 0% Scenes from a Crisis: January 28, 2009 “This crisis is attributable to a variety of factors and the major ones are: inappropriate macroeconomic policies of some economies and their unsustainable model of development characterized by prolonged low savings and high consumption; excessive expansion of financial institutions in a blind pursuit of profit; lack of self-discipline among financial institutions and rating agencies and the ensuing distortion of risk information and asset pricing; and the failure of financial supervision and regulation to keep up with financial innovations, which allowed the risks of financial derivatives to build and spread. As the saying goes, ‘A fall in the pit, a gain in your wit,’ we must draw lessons from this crisis and address its root causes. In other words, we must strike a balance between savings and consumption, between financial innovation and regulation, and between the financial sector and real economy." Chinese Premier Wen Jiabao at the World Economic Forum, Davos, Switzerland, January 28, 2009 The Global Imbalances Story Raghuram Rajan, Fault Lines (2010), pages 203 – 204: … the United States (and a few other rich industrial countries like Spain and the United Kingdom) have been spending more than they produce or earn and thus borrowing to finance the difference. Poorer countries like China or Vietnam have been doing the opposite … This mutually beneficial but ultimately unsustainable equilibrium has been disrupted by the financial crisis and the subsequent downturn … Indebted U.S. households, weighed down by houses that are worth less than mortgages they owe, have started saving more … Prudent macroeconomic management suggests that largedeficit countries should be more careful about spending and save more. If the world economy is not to slow considerably, the countries with trade surpluses will have to offset this shift by spending more … the poorer but fast-growing developing countries like China and Vietnam should gradually reduce their emphasis on exports and promote domestic consumption. Global Imbalances Tend to Correct Themselves – But Not as Quickly as We Might Like 12% China’s Current Account Surplus as a Percent of GDP 10% 8% 6% 4% 2% 0% -2% -4% 2010 2008 2006 2004 2002 2000 1998 1996 1992 1990 1988 1986 1984 1982 -8% 1994 U.S. Current Account Deficit as a Percent of GDP -6% State of the Union Address Washington, D.C., January 25 Source: Congressional Budget Office
