Stat 407 Lab 6 Classification Trees Fall 2001
advertisement
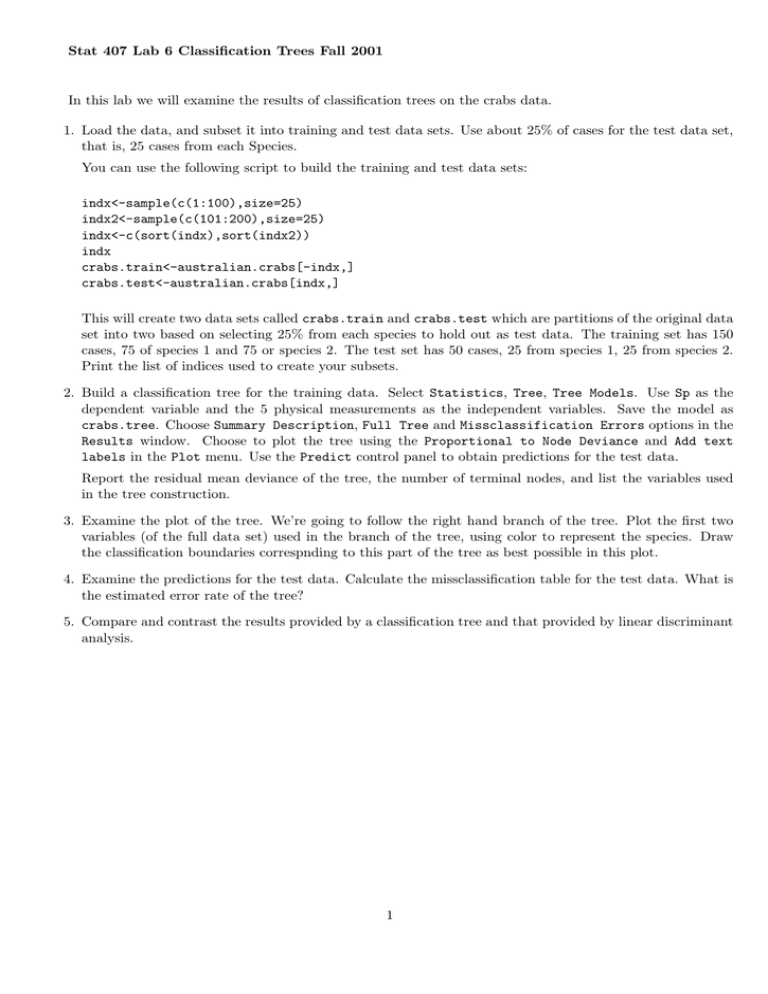
Stat 407 Lab 6 Classification Trees Fall 2001 In this lab we will examine the results of classification trees on the crabs data. 1. Load the data, and subset it into training and test data sets. Use about 25% of cases for the test data set, that is, 25 cases from each Species. You can use the following script to build the training and test data sets: indx<-sample(c(1:100),size=25) indx2<-sample(c(101:200),size=25) indx<-c(sort(indx),sort(indx2)) indx crabs.train<-australian.crabs[-indx,] crabs.test<-australian.crabs[indx,] This will create two data sets called crabs.train and crabs.test which are partitions of the original data set into two based on selecting 25% from each species to hold out as test data. The training set has 150 cases, 75 of species 1 and 75 or species 2. The test set has 50 cases, 25 from species 1, 25 from species 2. Print the list of indices used to create your subsets. 2. Build a classification tree for the training data. Select Statistics, Tree, Tree Models. Use Sp as the dependent variable and the 5 physical measurements as the independent variables. Save the model as crabs.tree. Choose Summary Description, Full Tree and Missclassification Errors options in the Results window. Choose to plot the tree using the Proportional to Node Deviance and Add text labels in the Plot menu. Use the Predict control panel to obtain predictions for the test data. Report the residual mean deviance of the tree, the number of terminal nodes, and list the variables used in the tree construction. 3. Examine the plot of the tree. We’re going to follow the right hand branch of the tree. Plot the first two variables (of the full data set) used in the branch of the tree, using color to represent the species. Draw the classification boundaries correspnding to this part of the tree as best possible in this plot. 4. Examine the predictions for the test data. Calculate the missclassification table for the test data. What is the estimated error rate of the tree? 5. Compare and contrast the results provided by a classification tree and that provided by linear discriminant analysis. 1
