Stat 407 Lab 2 (Summary Statistics of Multivariate Data) Fall... This lab is an introduction to using S-Plus with data...
advertisement
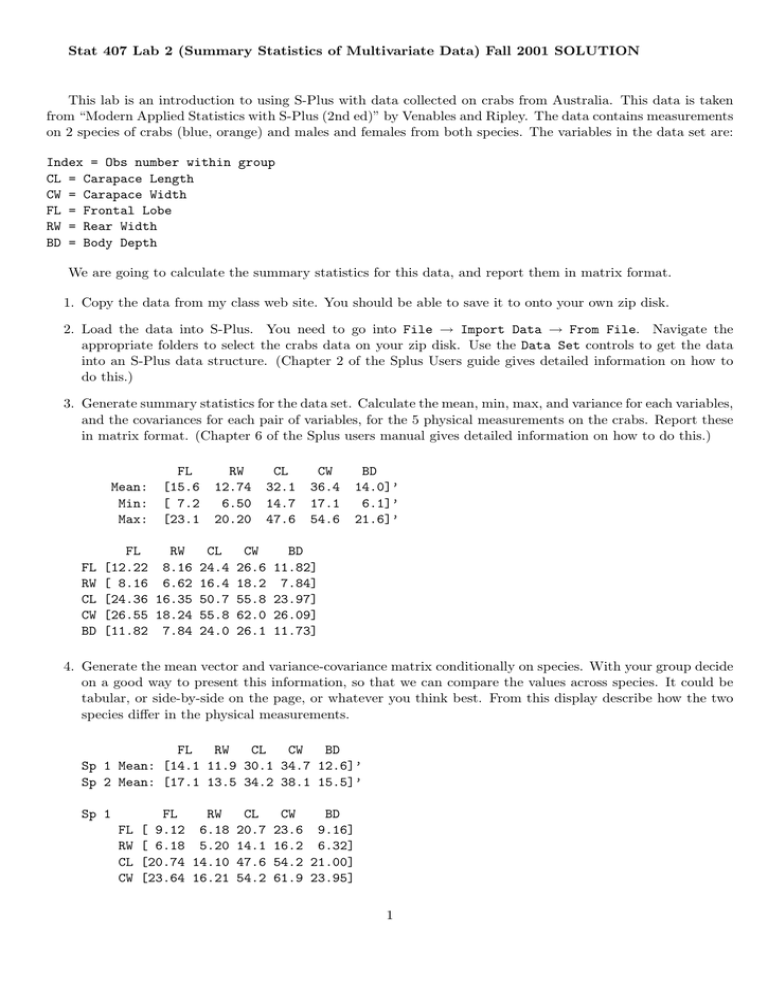
Stat 407 Lab 2 (Summary Statistics of Multivariate Data) Fall 2001 SOLUTION This lab is an introduction to using S-Plus with data collected on crabs from Australia. This data is taken from “Modern Applied Statistics with S-Plus (2nd ed)” by Venables and Ripley. The data contains measurements on 2 species of crabs (blue, orange) and males and females from both species. The variables in the data set are: Index = Obs number within group CL = Carapace Length CW = Carapace Width FL = Frontal Lobe RW = Rear Width BD = Body Depth We are going to calculate the summary statistics for this data, and report them in matrix format. 1. Copy the data from my class web site. You should be able to save it to onto your own zip disk. 2. Load the data into S-Plus. You need to go into File → Import Data → From File. Navigate the appropriate folders to select the crabs data on your zip disk. Use the Data Set controls to get the data into an S-Plus data structure. (Chapter 2 of the Splus Users guide gives detailed information on how to do this.) 3. Generate summary statistics for the data set. Calculate the mean, min, max, and variance for each variables, and the covariances for each pair of variables, for the 5 physical measurements on the crabs. Report these in matrix format. (Chapter 6 of the Splus users manual gives detailed information on how to do this.) Mean: Min: Max: FL RW CL CW BD FL [15.6 [ 7.2 [23.1 RW 12.74 6.50 20.20 CL 32.1 14.7 47.6 FL RW CL CW [12.22 8.16 24.4 26.6 [ 8.16 6.62 16.4 18.2 [24.36 16.35 50.7 55.8 [26.55 18.24 55.8 62.0 [11.82 7.84 24.0 26.1 CW 36.4 17.1 54.6 BD 14.0]’ 6.1]’ 21.6]’ BD 11.82] 7.84] 23.97] 26.09] 11.73] 4. Generate the mean vector and variance-covariance matrix conditionally on species. With your group decide on a good way to present this information, so that we can compare the values across species. It could be tabular, or side-by-side on the page, or whatever you think best. From this display describe how the two species differ in the physical measurements. FL RW CL CW BD Sp 1 Mean: [14.1 11.9 30.1 34.7 12.6]’ Sp 2 Mean: [17.1 13.5 34.2 38.1 15.5]’ Sp 1 FL RW CL CW FL RW CL [ 9.12 6.18 20.7 [ 6.18 5.20 14.1 [20.74 14.10 47.6 [23.64 16.21 54.2 CW BD 23.6 9.16] 16.2 6.32] 54.2 21.00] 61.9 23.95] 1 BD [ 9.16 Sp 2 FL RW CL CW BD 6.32 21.0 24.0 9.41] FL RW CL CW BD [10.73 7.72 21.9 24.5 10.14] [ 7.72 6.79 15.4 17.7 7.06] [21.90 15.42 45.8 50.8 21.19] [24.49 17.67 50.8 56.9 23.53] [10.14 7.06 21.2 23.5 9.93] Species 2 is slightly bigger overall, in terms of mean value. The variances and covariances are similar for both species. 5. In general language, explain what you learn by examining the summary statistics of multivariate data (that is, not in relation to this crabs data). Why is it important to calculate these and study them? What type of information can’t you learn about the nature of and relationship between variables, from studying only the mean and variance-covariance? From the mean and variance information we learn about the location and scale for the multiple variables. The means are single values which give an estimate for the center of the variable values. The variance provides information on the spread of the values around the mean value. The covariances provide information on how similar pairs of variables are, in a single numner. (The min and max provide the spread of the values in the sample.) 2
