PERFORMANCE ANALYSIS OF OPTIONS-BASED EQUITY MUTUAL
advertisement

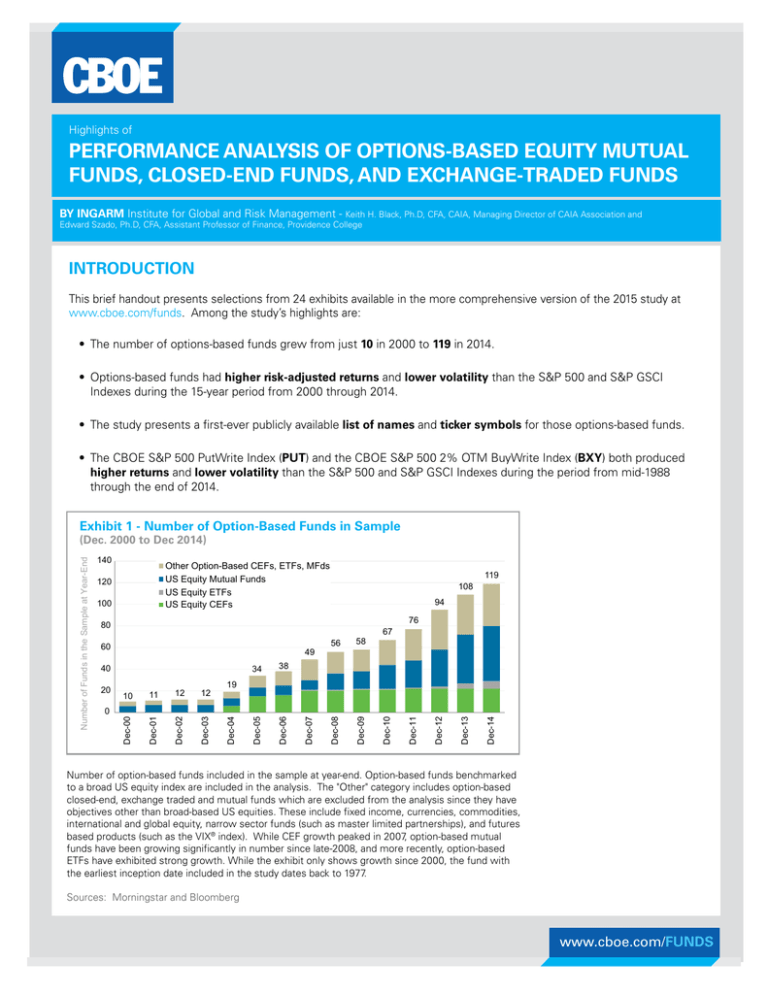
Highlights of PERFORMANCE ANALYSIS OF OPTIONS-BASED EQUITY MUTUAL FUNDS, CLOSED-END FUNDS, AND EXCHANGE-TRADED FUNDS BY INGARM Institute for Global and Risk Management - Keith H. Black, Ph.D, CFA, CAIA, Managing Director of CAIA Association and Edward Szado, Ph.D, CFA, Assistant Professor of Finance, Providence College INTRODUCTION This brief handout presents selections from 24 exhibits available in the more comprehensive version of the 2015 study at www.cboe.com/funds. Among the study’s highlights are: • The number of options-based funds grew from just 10 in 2000 to 119 in 2014. • Options-based funds had higher risk-adjusted returns and lower volatility than the S&P 500 and S&P GSCI Indexes during the 15-year period from 2000 through 2014. • The study presents a first-ever publicly available list of names and ticker symbols for those options-based funds. • The CBOE S&P 500 PutWrite Index (PUT) and the CBOE S&P 500 2% OTM BuyWrite Index (BXY) both produced higher returns and lower volatility than the S&P 500 and S&P GSCI Indexes during the period from mid-1988 through the end of 2014. Exhibit 1 - Number of Option-Based Funds in Sample Other Option-Based CEFs, ETFs, MFds US Equity Mutual Funds US Equity ETFs US Equity CEFs 56 58 Dec-09 38 67 76 Dec-14 Dec-13 19 Dec-07 12 34 Dec-06 12 Dec-04 11 Dec-03 0 10 Dec-02 20 Dec-01 40 Dec-05 49 Dec-08 80 60 119 94 Dec-11 100 108 Dec-10 120 Dec-12 140 Dec-00 Number of Funds in the Sample at Year-End (Dec. 2000 to Dec 2014) Number of option-based funds included in the sample at year-end. Option-based funds benchmarked to a broad US equity index are included in the analysis. The "Other" category includes option-based closed-end, exchange traded and mutual funds which are excluded from the analysis since they have objectives other than broad-based US equities. These include fixed income, currencies, commodities, international and global equity, narrow sector funds (such as master limited partnerships), and futures based products (such as the VIX® index). While CEF growth peaked in 2007, option-based mutual funds have been growing significantly in number since late-2008, and more recently, option-based ETFs have exhibited strong growth. While the exhibit only shows growth since 2000, the fund with the earliest inception date included in the study dates back to 1977. Sources: Morningstar and Bloomberg www.cboe.com/FUNDS Performance Analysis Highlights |2 Exhibit 2 - List of 80 Options-Based U.S. Equity Funds (December 2014) The largest funds in the sample are GATEX ($8.2B), ETY ($1.8B), BDJ ($1.7B) and NFJ ($1.7B), while GATEX (1977), TDEYX (1978) and MEQFX (1992) have the earliest inception dates. TYPE NAME TICKER TYPE NAME MFd Alliance Bernstein/TWM Global Equity & Covered Call Strategy Fund - Institutional TWMLX CEF Guggenheim EW Enhanced Equity Common MFd Hatteras Disciplined Opportunity - Institutional ETF Horizons S&P 500® Covered Call ETF HSPX ETF Horizons US Equity Managed Risk ETF HUS.U MFd Hussman Strategic Growth HSGFX MFd ICON Risk-Managed Balanced - Class A IOCAX MFd Investment Partners Opportunities - Class A IPOFX MFd Iron Horse - Class A IRHAX MFd Ironclad Managed Risk IRONX MFd JHancock Redwood - Class A JTRAX MFd KF Griffin Blue Chip Covered Call - Class A KFGAX MFd Kinetics Multi-Disciplinary Advisor - Class A KMDAX MFd KKM ARMOR A RMRAX MFd KKM US Equity ARMOR A UMRAX MFd Leigh Baldwin Total Return LEBOX MFd LS Theta - Institutional MFd Madison Covered Call & Equity Income - Class A CEF Madison Covered Call & Equity Strategy MCN CEF Madison Strategic Sector Premium Common MSP MFd MD Sass Equity Income Plus Fund - Institutional CEF Nuveen Core Equity Alpha Common JCE CEF Nuveen Dow 30 Dynamic Overwrite DIAX CEF Nuveen NASDAQ 100 Dynamic Overwrite QQQX CEF Nuveen S&P 500 Buy-Write Income BXMX CEF Nuveen S&P 500 Dynamic Overwrite SPXX CEF Nuveen Tax-Advantaged Dividend Growth Common ETF PowerShares S&P 500 Buy-Write ETF ETF Recon Capital NASDAQ 100 Covered Call ETF MFd RiverNorth Managed Volatility - Class R MFd RiverPark Structural Alpha - Institutional RSAIX MFd RiverPark/Gargoyle Hedged Value - Institutional RGHIX MFd Russell Strategic Call Overwriting - Class S ROWSX MFd Schooner - Class A SCNAX MFd Schooner Hedged Alternative Income - Institutional SHAIX MFd Swan Defined Risk - Class I SDRIX MFd Touchstone Dynamic Equity - Class Y TDEYX ETF US Equity High Volatility Put Write ETF HVPW MFd Virtus Low Volatility Equity - Class A VLVAX MFd WP Large Cap Income Plus - Institutional WPLCX MFd YCG Enhanced YCGEX CEF AllianzGI NFJ Dividend Interest & Premium Common MFd AllianzGI Structured Return A-Class MFd AllianzGI US Equity-Hedged - Institutional AZUIX MFd AMG FQ US Equity - Institutional MEQFX MFd Arin Large Cap Theta - Institutional AVOLX MFd ASTON/Anchor Capital Enhanced Equity - Institutional AMDSX CEF BlackRock Enhanced Capital & Income Common CEF BlackRock Enhanced Equity Dividend Common MFd BPV Low Volatility MFd BPV Wealth Preservation Advisor BPAPX MFd Bridgeway Managed Volatility BRBPX MFd Camelot Excalibur Small Cap Income - Class A CEXAX MFd Camelot Premium Return - Class A CPRFX MFd Catalyst/Lyons Hedged Premium Return - A CLPAX MFd Catalyst/SMH Total Return Income - Class A TRIFX MFd Centaur Total Return TILDX CEF Columbia Seligman Premium Technology MFd Covered Bridge - Class A TCBAX MFd Credit Suisse Volaris US Strategies - Class A VAEAX MFd Crow Point Defined Risk Global Equity Income - Class A CGHAX MFd Dividend Plus Income Fund - Institutional MAIPX MFd Dunham Monthly Distribution Fund - Class A DAMDX CEF Eaton Vance Enhanced Equity Income Common EOI CEF Eaton Vance Enhanced Equity Income II Common EOS MFd Eaton Vance Hedged Stock - Institutional CEF Eaton Vance Risk-Managed Diversified Equity Income Common ETJ CEF Eaton Vance Tax-Managed Buy-Write Income Common ETB CEF Eaton Vance Tax-Managed Buy-Write Opportunities Common ETV CEF Eaton Vance Tax-Managed Dividend Equity Income Common ETY CEF First Trust Enhanced Equity Income Common FFA ETF First Trust High Income ETF FTHI ETF First Trust Low Beta Income ETF FTLB MFd Frost Cinque Large Cap Buy-Write Equity - A FCAWX MFd Gateway - Class A GATEX MFd Gateway Equity Call Premium - Class A GCPAX MFd Glenmede Secured Options GTSOX MFd GMO Risk Premium - Class III GMRPX CEF Guggenheim Enhanced Equity Income Common GPM CEF Guggenheim Enhanced Equity Strategy Common GGE NFJ AZIAX CII BDJ BPVLX STK EROIX TICKER GEQ HDOIX LQTIX MENAX MDEIX JTD PBP QYLD RNBWX Eighty options-based equity funds are used in the performance analysis. These funds consist of 51 mutual funds (MFd), 22 closed-end funds (CEF), and 7 exchange-traded index funds (ETF). The sample has a current AUM of $27.6 billion. As noted on page 4, the inclusion of references to registered funds in this paper should not be construed as an endorsement or an indication of the value of any product, security, fund, service, or other website. Such financial products are not sponsored, endorsed, sold or promoted by CBOE or INGARM. Sources: Morningstar and Bloomberg www.cboe.com/FUNDS Options-Based Equity Mutual Funds, Closed-End Funds, and Exchange-Traded Funds |3 Exhibit 3 – List of 39 Other Options-Based Funds (December 2014) TICKER TYPE NAME VEGA CEF JH Hedged Equity & Income Fund NIE CEF JH Tax Advantaged Global Shareholder Yield HTY MMAFX CEF Kayne Anderson Midstream Energy KMF BlackRock Global Opportunities BOE MFd Kinetics Alternative Income - No Load KWINX BlackRock Health Sciences BME MFd Kinetics Multi-Disciplinary - No Load KMDNX CEF BlackRock Resources & Commdity BCX CEF MS India Investment CEF BlackRock Utility & Infrastructure Trust BUI CEF Nuveen Diversified Commodity MFd Catalyst/MAP Global Capital Appreciation - Class A CAXAX CEF Nuveen Long/Short Commodity Total Return MFd Catalyst/MAP Global Total Return Income - Class A TRXAX MFd Regal Total Return - Class A RTRTX CEF Central Securities Corporation CET MFd Robeco Boston Partners All Cap Value - Institutional BPAIX GLO CEF Salient Midstream & MLP SMM TYPE NAME ETF AdvisorShares STAR Global Buy-Write ETF CEF AllianzGI Equity & Convertible Income MFd AMG FQ Global Risk-Balanced - Institutional CEF CEF TICKER HEQ IIF CFD CTF CEF Clough Global Opportunities CEF EV Tax-Managed Global Diversity Equity Income EXG MFd Sandalwood Opportunity - Class A SANAX CEF Fiduciary/Claymore MLP Opportunity FMO MFd Virtus Strategic Income - Class A VASBX ETF First Trust CBOE® S&P 500 VIX®Tail Hedge ETF VIXH CEF Voya Global Advantage and Premium Opportunity IGA CEF First Trust MLP & Energy Income Fund FEI CEF Voya Global Equity Dividend&Premium Opportunity IGD CEF Gabelli Equity Trust GAB CEF Voya Infrastructure Industrials & Materials IDE CEF GAMCO Global Gold Natural Resource & Income GGN CEF Voya International High Dividend Equity Income IID CEF GAMCO Natural Resource Gold & Income GNT CEF Voya Natural Resources Equity Income IRR MFd Gateway International - Class A GAIAX CEF Wells Fargo Adv Global Dividend Opportunity EOD MFd Glenmede International Secured Options NOVIX Thirty-nine Additional Options-Based Funds with $18.6 billion AUM (these funds were not used in performance analysis). These include 26 CEFs with AUM of $16.9 Billion, 11 Mutual Funds with AUM of $1.7 Billion and 2 ETFs with AUM of $30 Million. Additionally, two ETNs were identified (GLDI and BWV) which are not included in the above list. Exhibit 4 - Options-Based Funds and Stock Indices Growth of $100 $200 $186 - Options-Based Funds $180 $186 - S&P 500 $182 - BXM Index $160 $146 - MSCI EAFE USD $140 $120 $100 $80 Dec-14 Dec-13 Dec-12 Dec-11 Dec-10 Dec-09 Dec-08 Dec-07 Dec-06 Dec-05 Dec-04 Dec-03 Dec-02 Dec-01 $40 Dec-00 $60 Dec-99 Cumulative Monthly Total Return Indices Scaled to a Starting Value of $100 on December 31, 1999 (Jan. 1, 2000 – Dec. 31, 2014) Cumulative monthly total return since December 31, 1999 for a monthly rebalanced equally weighted portfolio of Options-Based Funds, the BXM index and various traditional indices. Performance is scaled to represent a starting value of $100 on December 31, 1999 for all indices. Performance of the Equally Weighted Option-Based Fund Portfolio closely tracks the BXM index. The Equally Weighted Option-Based Fund Portfolio returns are calculated by averaging the returns across all constituents in the sample available at each month-end. The number of funds included in the calculation grows monthly as new funds enter the sample, and at the end of 2014, there were 80 funds in the sample. www.cboe.com/FUNDS Options-Based Equity Mutual Funds, Closed-End Funds, and Exchange-Traded Funds |4 Exhibit 5 - Annualized Standard Deviation - Options-Based Funds and Benchmark Indices (Jan. 1, 2000 to Dec. 31, 2014) Options-Based Funds 11.1% BXM Index 11.4% Citi Treasury 30 Yr 13.8% S&P 500 15.3% MSCI EAFE USD 17.4% S&P GSCI 0% 23.4% 5% 10% 15% 20% 25% Options-Based Funds had a lower standard deviation than the S&P 500 Index. More Information A more comprehensive version of this paper (available at www.ingram.org and www.cboe.com/funds) has Exhibits that show: • The BXM, PUT, and BXY options-based benchmark indexes all had a positive alpha and a lower standard deviation of returns than the S&P 500 Index in the period from mid-1988 through 2014. • Over the past 25 years, equity index options usually have been richly valued, as the implied volatility has historically tended to exceed realized volatility. • Fund managers examine trading liquidity and capacity when considering investment vehicles, and the estimated notional value of average daily volume in S&P 500® (SPX) options in 2014 was more than $170 billion. --The authors are grateful for the valuable research support of graduate students Satyabrota Das and Abdul Mohi Khizer from the Isenberg School of Management at the University of Massachusetts-Amherst.-- The inclusion of references to registered funds in this paper should not be construed as an endorsement or an indication of the value of any product, security, fund, service, or other website. Such financial products are not sponsored, endorsed, sold or promoted by CBOE or INGARM. CBOE and INGARM make no representation regarding the advisability of investing in such products. An investor should consider the investment objectives, risks, charges, and expenses of these products carefully before investing. Before investing in any fund or security, please read closely the applicable prospectus and other legal information. Chicago Board Options Exchange® (CBOE®) provided financial support for the research for this paper. Options involve risk and are not suitable for all investors. Prior to buying or selling an option, a person must receive a copy of Characteristics and Risks of Standardized Options. Copies are available from your broker, by calling 1-888-OPTIONS, or from The Options Clearing Corporation at www.theocc.com. The information in this paper is provided for general education and information purposes only. No statement within this paper should be construed as a recommendation to buy or sell a security or to provide investment advice. The BXM, BXY, CLL and PUT indices (the “Indexes”) are designed to represent proposed hypothetical options strategies. The actual performance of investment vehicles such as mutual funds or managed accounts can have significant differences from the performance of the Indexes. Investors attempting to replicate the Indexes should discuss with their advisors possible timing and liquidity issues. Like many passive benchmarks, the Indexes do not take into account significant factors such as transaction costs and taxes. Transaction costs and taxes for strategies such as the Indexes could be significantly higher than transaction costs for a passive strategy of buying-and-holding stocks. Investors should consult their tax advisor as to how taxes affect the outcome of contemplated options transactions. Past performance does not guarantee future results. This document contains index performance data based on back-testing, i.e., calculations of how the index might have performed prior to launch. Back-tested performance information is purely hypothetical and is provided in this paper solely for informational purposes. Back-tested performance does not represent actual performance and should not be interpreted as an indication of actual performance. It is not possible to invest directly in an index. CBOE calculates and disseminates the Indexes. Supporting documentation for any claims, comparisons, statistics or other technical data in this paper is available from CBOE upon request. The methodologies of the Indexes are the property of Chicago Board Options Exchange, Incorporated (CBOE). CBOE®, Chicago Board Options Exchange®, CBOE Volatility Index® and VIX® are registered trademarks and BXM, BXY, BuyWrite, CLL, PUT and PutWrite are service marks of CBOE. S&P® and S&P 500® are registered trademarks of Standard and Poor’s Financial Services, LLC and are licensed for use by CBOE. Financial products based on S&P indices are not sponsored, endorsed, sold or promoted by Standard & Poor’s, and Standard & Poor’s makes no representation regarding the advisability of investing in such products. All other trademarks and service marks are the property of their respective owners. The Indexes and all other information provided by CBOE and its affiliates and their respective directors, officers, employees, agents, representatives and third party providers of information (the “Parties”) in connection with the Indexes (collectively “Data”) are presented “as is” and without representations or warranties of any kind. The Parties shall not be liable for loss or damage, direct, indirect or consequential, arising from any use of the Data or action taken in reliance upon the Data. Redistribution, reproduction and/or photocopying in whole or in part are prohibited without the written permission of CBOE. Please email comments to eszado@providence.edu, kblack@caia.org or institutional@cboe.com. CBOE | 400 South LaSalle Street | Chicago, IL 60605 February 2016


