STAT 496, Spring 2003 Homework Assignment #5
advertisement
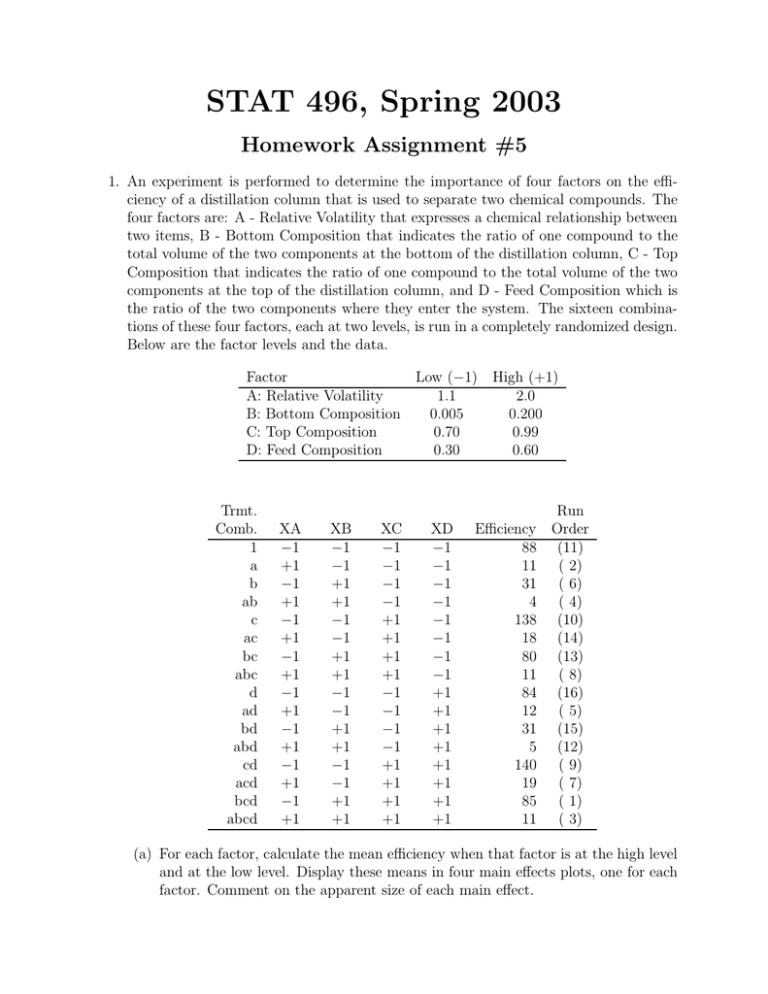
STAT 496, Spring 2003 Homework Assignment #5 1. An experiment is performed to determine the importance of four factors on the efficiency of a distillation column that is used to separate two chemical compounds. The four factors are: A - Relative Volatility that expresses a chemical relationship between two items, B - Bottom Composition that indicates the ratio of one compound to the total volume of the two components at the bottom of the distillation column, C - Top Composition that indicates the ratio of one compound to the total volume of the two components at the top of the distillation column, and D - Feed Composition which is the ratio of the two components where they enter the system. The sixteen combinations of these four factors, each at two levels, is run in a completely randomized design. Below are the factor levels and the data. Factor Low (−1) A: Relative Volatility 1.1 B: Bottom Composition 0.005 C: Top Composition 0.70 D: Feed Composition 0.30 Trmt. Comb. 1 a b ab c ac bc abc d ad bd abd cd acd bcd abcd XA −1 +1 −1 +1 −1 +1 −1 +1 −1 +1 −1 +1 −1 +1 −1 +1 XB −1 −1 +1 +1 −1 −1 +1 +1 −1 −1 +1 +1 −1 −1 +1 +1 XC −1 −1 −1 −1 +1 +1 +1 +1 −1 −1 −1 −1 +1 +1 +1 +1 XD −1 −1 −1 −1 −1 −1 −1 −1 +1 +1 +1 +1 +1 +1 +1 +1 High (+1) 2.0 0.200 0.99 0.60 Efficiency 88 11 31 4 138 18 80 11 84 12 31 5 140 19 85 11 Run Order (11) ( 2) ( 6) ( 4) (10) (14) (13) ( 8) (16) ( 5) (15) (12) ( 9) ( 7) ( 1) ( 3) (a) For each factor, calculate the mean efficiency when that factor is at the high level and at the low level. Display these means in four main effects plots, one for each factor. Comment on the apparent size of each main effect. (b) Construct interaction plots for the four factors. Pay particular attention to the combinations of A - Relative Volatility with B - Bottom Composition, A - Relative Volatility with C - Top Composition, B - Bottom Composition with C - Top Composition. Comment on the apparent presence or absence of interaction for these three combinations. (c) Compute the overall grand sample mean and the 15 estimated effects. Be sure to indicate whether you are computing estimated full effects of half effects. (d) Construct a normal probability plot for the 15 estimated effects. Label on your plot effects that appear to be significant. (e) You should be able to pick up some pseudo replication by eliminating a factor and all its interactions with the other three factors. This should give you a 23 experiment with 2 replicates. With this reduced model, compute MSrepError and the standard error of an estimate. (f) Which of the remaining estimated effects are significant? non-significant? (g) Give the most parsimonious (include only significant terms) prediction equation. Be sure to explicitly define each variable in the equation. (h) In order to maximize the efficiency of this distillation column, what settings of the four factors would you recommend? (i) Give a predicted value, and prediction interval, for the filtration rate at the choice of factor levels you give in (h). Be sure to indicate what you are using for the estimate of error variation and why. (j) Using the prediction equation in (g) construct plots of residuals versus predicted values and residuals versus run order. Are there any discernible patterns in these plots? Note: You may use JMP, or another computer program, to assist you with any of the graphing or calculations needed to answer the questions above.
