Connectivity in Math-Gifted Adolescents: Comparing SEM with Granger Causality Analysis
advertisement
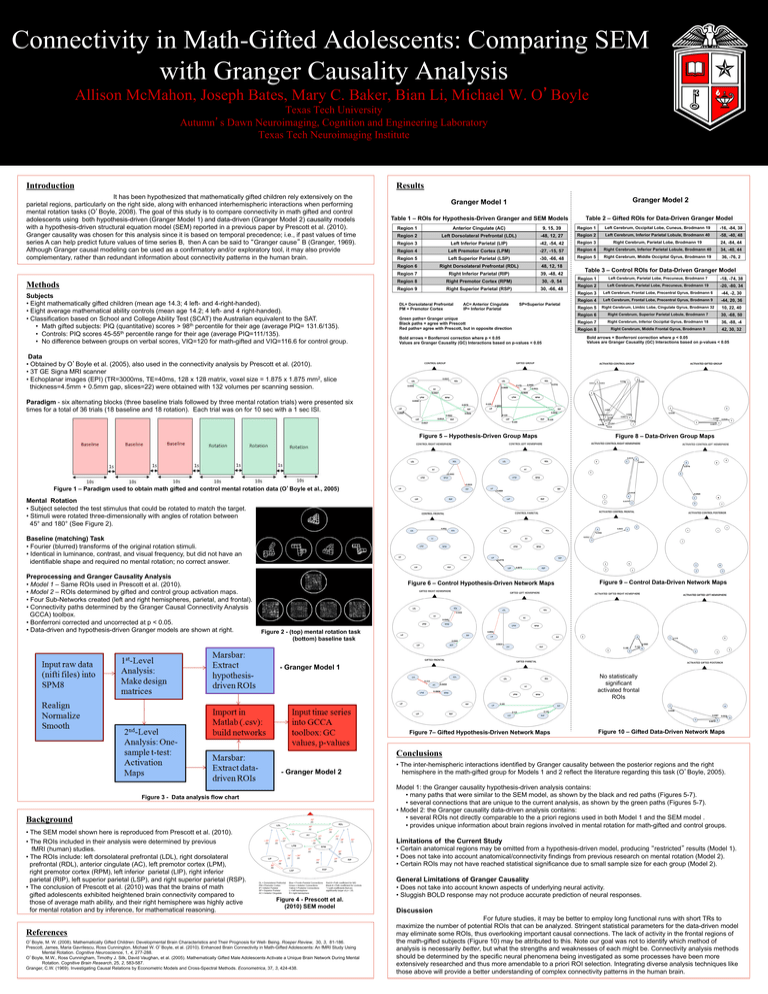
Connectivity in Math-Gifted Adolescents: Comparing SEM with Granger Causality Analysis Allison McMahon, Joseph Bates, Mary C. Baker, Bian Li, Michael W. O Boyle Texas Tech University Autumn s Dawn Neuroimaging, Cognition and Engineering Laboratory Texas Tech Neuroimaging Institute Introduction Figure 4 - Prescott and colleagues 2010 SEM model Results It has been hypothesized that mathematically gifted children rely extensively on the parietal regions, particularly on the right side, along with enhanced interhemispheric interactions when performing mental rotation tasks (O Boyle, 2008). The goal of this study is to compare connectivity in math gifted and control adolescents using both hypothesis-driven (Granger Model 1) and data-driven (Granger Model 2) causality models with a hypothesis-driven structural equation model (SEM) reported in a previous paper by Prescott et al. (2010). Granger causality was chosen for this analysis since it is based on temporal precedence; i.e., if past values of time series A can help predict future values of time series B, then A can be said to Granger cause B (Granger, 1969). Although Granger causal modeling can be used as a confirmatory and/or exploratory tool, it may also provide complementary, rather than redundant information about connectivity patterns in the human brain. Methods Subjects • Eight mathematically gifted children (mean age 14.3; 4 left- and 4-right-handed). • Eight average mathematical ability controls (mean age 14.2; 4 left- and 4 right-handed). • Classification based on School and College Ability Test (SCAT) the Australian equivalent to the SAT. • Math gifted subjects: PIQ (quantitative) scores > 98th percentile for their age (average PIQ= 131.6/135). • Controls: PIQ scores 45-55th percentile range for their age (average PIQ=111/135). • No difference between groups on verbal scores, VIQ=120 for math-gifted and VIQ=116.6 for control group. Granger Model 1 Granger Model 2 Table 1 – ROIs for Hypothesis-Driven Granger and SEM Models Table 2 – Gifted ROIs for Data-Driven Granger Model Region 1 Anterior Cingulate (AC) 9, 15, 39 Region 1 Left Cerebrum, Occipital Lobe, Cuneus, Brodmann 19 -16, -84, 38 Region 2 Left Dorsolateral Prefrontal (LDL) -48, 12, 27 Region 2 Left Cerebrum, Inferior Parietal Lobule, Brodmann 40 -58, -40, 48 Region 3 Left Inferior Parietal (LIP) -42, -54, 42 Region 3 Right Cerebrum, Parietal Lobe, Brodmann 19 24, -84, 44 Region 4 Left Premotor Cortex (LPM) -27, -15, 57 Region 4 Right Cerebrum, Inferior Parietal Lobule, Brodmann 40 34, -40, 44 Region 5 Left Superior Parietal (LSP) -30, -66, 48 Region 5 Right Cerebrum, Middle Occipital Gyrus, Brodmann 19 36, -76, 2 Region 6 Right Dorsolateral Prefrontal (RDL) 48, 12, 18 Region 7 Right Inferior Parietal (RIP) 39, -48, 42 Region 8 Right Premotor Cortex (RPM) 30, -9, 54 Region 9 Right Superior Parietal (RSP) 30, -66, 48 DL= Dorsolateral Prefrontal PM = Premotor Cortex AC= Anterior Cingulate IP= Inferior Parietal SP=Superior Parietal Green paths= Granger unique Black paths = agree with Prescott Red paths= agree with Prescott, but in opposite direction Bold arrows = Bonferroni correction where p < 0.05 Values are Granger Causality (GC) Interactions based on p-values < 0.05 Table 3 – Control ROIs for Data-Driven Granger Model Region 1 Left Cerebrum, Parietal Lobe, Precuneus, Brodmann 7 -18, -74, 38 Region 2 Left Cerebrum, Parietal Lobe, Precuneus, Brodmann 19 -20, -80, 34 Region 3 Left Cerebrum, Frontal Lobe, Precentral Gyrus, Brodmann 6 -44, -2, 30 Region 4 Left Cerebrum, Frontal Lobe, Precentral Gyrus, Brodmann 9 -44, 20, 36 Region 5 Right Cerebrum, Limbic Lobe, Cingulate Gyrus, Brodmann 32 10, 22, 40 Region 6 Right Cerebrum, Superior Parietal Lobule, Brodmann 7 30, -68, 50 Region 7 Right Cerebrum, Inferior Occipital Gyrus, Brodmann 18 36, -88, -4 Region 8 Right Cerebrum, Middle Frontal Gyrus, Brodmann 9 42, 30, 32 Bold arrows = Bonferroni correction where p < 0.05 Values are Granger Causality (GC) Interactions based on p-values < 0.05 Data • Obtained by O Boyle et al. (2005), also used in the connectivity analysis by Prescott et al. (2010). • 3T GE Signa MRI scanner • Echoplanar images (EPI) (TR=3000ms, TE=40ms, 128 x 128 matrix, voxel size = 1.875 x 1.875 mm2, slice thickness=4.5mm + 0.5mm gap, slices=22) were obtained with 132 volumes per scanning session. Paradigm - six alternating blocks (three baseline trials followed by three mental rotation trials) were presented six times for a total of 36 trials (18 baseline and 18 rotation). Each trial was on for 10 sec with a 1 sec ISI. Figure 5 – Hypothesis-Driven Group Maps Figure 8 – Data-Driven Group Maps Figure 1 – Paradigm used to obtain math gifted and control mental rotation data (O Boyle et al., 2005) Mental Rotation • Subject selected the test stimulus that could be rotated to match the target. • Stimuli were rotated three-dimensionally with angles of rotation between 45° and 180° (See Figure 2). Baseline (matching) Task • Fourier (blurred) transforms of the original rotation stimuli. • Identical in luminance, contrast, and visual frequency, but did not have an identifiable shape and required no mental rotation; no correct answer. Preprocessing and Granger Causality Analysis • Model 1 – Same ROIs used in Prescott et al. (2010). • Model 2 – ROIs determined by gifted and control group activation maps. • Four Sub-Networks created (left and right hemispheres, parietal, and frontal). • Connectivity paths determined by the Granger Causal Connectivity Analysis GCCA) toolbox. • Bonferroni corrected and uncorrected at p < 0.05. • Data-driven and hypothesis-driven Granger models are shown at right. Figure 6 – Control Hypothesis-Driven Network Maps Figure 9 – Control Data-Driven Network Maps Figure 2 - (top) mental rotation task (bottom) baseline task - Granger Model 1 No statistically significant activated frontal ROIs Figure 7– Gifted Hypothesis-Driven Network Maps Figure 10 – Gifted Data-Driven Network Maps Conclusions - Granger Model 2 Model 1: the Granger causality hypothesis-driven analysis contains: • many paths that were similar to the SEM model, as shown by the black and red paths (Figures 5-7). • several connections that are unique to the current analysis, as shown by the green paths (Figures 5-7). • Model 2: the Granger causality data-driven analysis contains: • several ROIs not directly comparable to the a priori regions used in both Model 1 and the SEM model . • provides unique information about brain regions involved in mental rotation for math-gifted and control groups. Figure 3 - Data analysis flow chart Background • The SEM model shown here is reproduced from Prescott et al. (2010). • The ROIs included in their analysis were determined by previous fMRI (human) studies. • The ROIs include: left dorsolateral prefrontal (LDL), right dorsolateral prefrontal (RDL), anterior cingulate (AC), left premotor cortex (LPM), right premotor cortex (RPM), left inferior parietal (LIP), right inferior parietal (RIP), left superior parietal (LSP), and right superior parietal (RSP). • The conclusion of Prescott et al. (2010) was that the brains of math gifted adolescents exhibited heightened brain connectivity compared to those of average math ability, and their right hemisphere was highly active for mental rotation and by inference, for mathematical reasoning. • The inter-hemispheric interactions identified by Granger causality between the posterior regions and the right hemisphere in the math-gifted group for Models 1 and 2 reflect the literature regarding this task (O Boyle, 2005). Limitations of the Current Study • Certain anatomical regions may be omitted from a hypothesis-driven model, producing restricted results (Model 1). • Does not take into account anatomical/connectivity findings from previous research on mental rotation (Model 2). • Certain ROIs may not have reached statistical significance due to small sample size for each group (Model 2). Figure 4 - Prescott et al. (2010) SEM model References O Boyle, M. W. (2008). Mathematically Gifted Children: Developmental Brain Characteristics and Their Prognosis for Well- Being. Roeper Review, 30, 3, 81-186. Prescott, James, Maria Gavrilescu, Ross Cunnington, Michael W. O Boyle, et al. (2010). Enhanced Brain Connectivity in Math-Gifted Adolescents: An fMRI Study Using Mental Rotation. Cognitive Neuroscience, 1, 4, 277-288. O Boyle, M.W., Ross Cunningham, Timothy J. Silk, David Vaughan, et al. (2005). Mathematically Gifted Male Adolescents Activate a Unique Brain Network During Mental Rotation. Cognitive Brain Research, 25, 2, 583-587. Granger, C.W. (1969). Investigating Causal Relations by Econometric Models and Cross-Spectral Methods. Econometrica, 37, 3, 424-438. General Limitations of Granger Causality • Does not take into account known aspects of underlying neural activity. • Sluggish BOLD response may not produce accurate prediction of neural responses. Discussion For future studies, it may be better to employ long functional runs with short TRs to maximize the number of potential ROIs that can be analyzed. Stringent statistical parameters for the data-driven model may eliminate some ROIs, thus overlooking important causal connections. The lack of activity in the frontal regions of the math-gifted subjects (Figure 10) may be attributed to this. Note our goal was not to identify which method of analysis is necessarily better, but what the strengths and weaknesses of each might be. Connectivity analysis methods should be determined by the specific neural phenomena being investigated as some processes have been more extensively researched and thus more amendable to a priori ROI selection. Integrating diverse analysis techniques like those above will provide a better understanding of complex connectivity patterns in the human brain.
