ABSTRACT The origin of the vertical motions of East Greenland is... standing enigma. The area is characterized by a mountain chain
advertisement
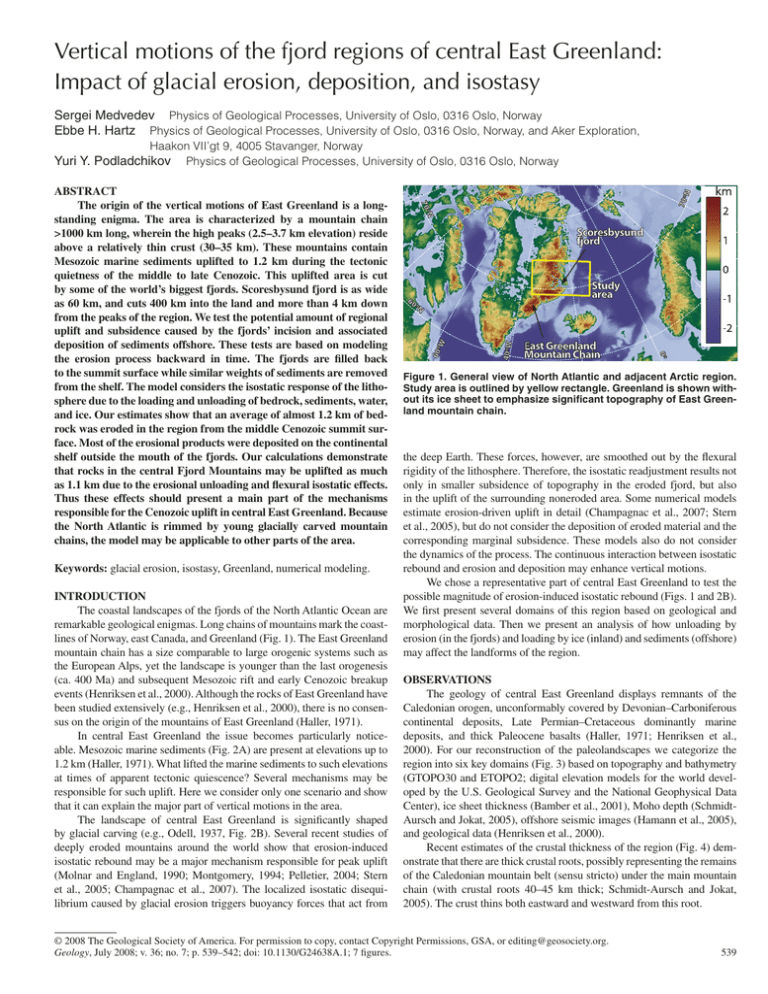
Vertical motions of the fjord regions of central East Greenland: Impact of glacial erosion, deposition, and isostasy Sergei Medvedev Physics of Geological Processes, University of Oslo, 0316 Oslo, Norway Ebbe H. Hartz Physics of Geological Processes, University of Oslo, 0316 Oslo, Norway, and Aker Exploration, Haakon VII’gt 9, 4005 Stavanger, Norway Physics of Geological Processes, University of Oslo, 0316 Oslo, Norway Yuri Y. Podladchikov ABSTRACT The origin of the vertical motions of East Greenland is a longstanding enigma. The area is characterized by a mountain chain >1000 km long, wherein the high peaks (2.5–3.7 km elevation) reside above a relatively thin crust (30–35 km). These mountains contain Mesozoic marine sediments uplifted to 1.2 km during the tectonic quietness of the middle to late Cenozoic. This uplifted area is cut by some of the world’s biggest fjords. Scoresbysund fjord is as wide as 60 km, and cuts 400 km into the land and more than 4 km down from the peaks of the region. We test the potential amount of regional uplift and subsidence caused by the fjords’ incision and associated deposition of sediments offshore. These tests are based on modeling the erosion process backward in time. The fjords are filled back to the summit surface while similar weights of sediments are removed from the shelf. The model considers the isostatic response of the lithosphere due to the loading and unloading of bedrock, sediments, water, and ice. Our estimates show that an average of almost 1.2 km of bedrock was eroded in the region from the middle Cenozoic summit surface. Most of the erosional products were deposited on the continental shelf outside the mouth of the fjords. Our calculations demonstrate that rocks in the central Fjord Mountains may be uplifted as much as 1.1 km due to the erosional unloading and flexural isostatic effects. Thus these effects should present a main part of the mechanisms responsible for the Cenozoic uplift in central East Greenland. Because the North Atlantic is rimmed by young glacially carved mountain chains, the model may be applicable to other parts of the area. Keywords: glacial erosion, isostasy, Greenland, numerical modeling. INTRODUCTION The coastal landscapes of the fjords of the North Atlantic Ocean are remarkable geological enigmas. Long chains of mountains mark the coastlines of Norway, east Canada, and Greenland (Fig. 1). The East Greenland mountain chain has a size comparable to large orogenic systems such as the European Alps, yet the landscape is younger than the last orogenesis (ca. 400 Ma) and subsequent Mesozoic rift and early Cenozoic breakup events (Henriksen et al., 2000). Although the rocks of East Greenland have been studied extensively (e.g., Henriksen et al., 2000), there is no consensus on the origin of the mountains of East Greenland (Haller, 1971). In central East Greenland the issue becomes particularly noticeable. Mesozoic marine sediments (Fig. 2A) are present at elevations up to 1.2 km (Haller, 1971). What lifted the marine sediments to such elevations at times of apparent tectonic quiescence? Several mechanisms may be responsible for such uplift. Here we consider only one scenario and show that it can explain the major part of vertical motions in the area. The landscape of central East Greenland is significantly shaped by glacial carving (e.g., Odell, 1937, Fig. 2B). Several recent studies of deeply eroded mountains around the world show that erosion-induced isostatic rebound may be a major mechanism responsible for peak uplift (Molnar and England, 1990; Montgomery, 1994; Pelletier, 2004; Stern et al., 2005; Champagnac et al., 2007). The localized isostatic disequilibrium caused by glacial erosion triggers buoyancy forces that act from Figure 1. General view of North Atlantic and adjacent Arctic region. Study area is outlined by yellow rectangle. Greenland is shown without its ice sheet to emphasize significant topography of East Greenland mountain chain. the deep Earth. These forces, however, are smoothed out by the flexural rigidity of the lithosphere. Therefore, the isostatic readjustment results not only in smaller subsidence of topography in the eroded fjord, but also in the uplift of the surrounding noneroded area. Some numerical models estimate erosion-driven uplift in detail (Champagnac et al., 2007; Stern et al., 2005), but do not consider the deposition of eroded material and the corresponding marginal subsidence. These models also do not consider the dynamics of the process. The continuous interaction between isostatic rebound and erosion and deposition may enhance vertical motions. We chose a representative part of central East Greenland to test the possible magnitude of erosion-induced isostatic rebound (Figs. 1 and 2B). We first present several domains of this region based on geological and morphological data. Then we present an analysis of how unloading by erosion (in the fjords) and loading by ice (inland) and sediments (offshore) may affect the landforms of the region. OBSERVATIONS The geology of central East Greenland displays remnants of the Caledonian orogen, unconformably covered by Devonian–Carboniferous continental deposits, Late Permian–Cretaceous dominantly marine deposits, and thick Paleocene basalts (Haller, 1971; Henriksen et al., 2000). For our reconstruction of the paleolandscapes we categorize the region into six key domains (Fig. 3) based on topography and bathymetry (GTOPO30 and ETOPO2; digital elevation models for the world developed by the U.S. Geological Survey and the National Geophysical Data Center), ice sheet thickness (Bamber et al., 2001), Moho depth (SchmidtAursch and Jokat, 2005), offshore seismic images (Hamann et al., 2005), and geological data (Henriksen et al., 2000). Recent estimates of the crustal thickness of the region (Fig. 4) demonstrate that there are thick crustal roots, possibly representing the remains of the Caledonian mountain belt (sensu stricto) under the main mountain chain (with crustal roots 40–45 km thick; Schmidt-Aursch and Jokat, 2005). The crust thins both eastward and westward from this root. © 2008 The Geological Society of America. For permission to copy, contact Copyright Permissions, GSA, or editing@geosociety.org. GEOLOGY, 2008 Geology, JulyJuly 2008; v. 36; no. 7; p. 539–542; doi: 10.1130/G24638A.1; 7 figures. 539 A B Figure 3. Bedrock topography of study area (with ice removed). We outline here several regional domains. (1) Caledonian foreland is part of central Greenland depression covered by ice sheet 2–3 km deep. (2) Main mountain chain is part of East Greenland mountain chain and comprises continuous 2.5–3-km-elevation mountains. Eastern boundary of this domain coincides with the tails of fjords. (3) Fjord Mountains exhibit dramatic, +3 to –1.5 km, topographic variations. (4) Uplifted marine sediments consist mainly of marine deposits now lifted to 1.2 km elevation. (5) Continental shelf includes shallow (0–800 m deep) offshore area covered by >3 km of Pliocene– Pleistocene (5–0.01 Ma) sediments in that area (Hamann et al., 2005). (6) Oceanic floor is separated by narrow strip of fast change in bathymetry. Arrows (a and b) show place and direction of view of photographs of Figure 2. Figure 2. A: Late Permian, Triassic, Jurassic, and mid-Cretaceous dominantly marine sediments, cut by sills and dikes of ca. 55 Ma diabase. Marine sediments at top are elevated to 1.2 km above the fjord in lower left corner. B: Glacier Korridoren in north-central Milne Land. Surface is at ~2 km elevation. Glacier extends to sea level just below field of view. The glacier enters the fjord just outside the picture; this fjord is ~1 km deep, resulting in total of 3 km of rock section. (See locations and direction of the views in Fig. 3.). The main interest of this study is in the two domains, the Fjord Mountains and uplifted marine sediments. The highest peaks of Greenland are here, on the relatively thin continental crust (Moho depth is ~30 km; Fig. 4). The uplifted marine rocks on the eastern side of these Fjord Mountains represent a conservative estimate of 1.2 km of late Cenozoic uplift (Fig. 2A). These adjacent areas are characterized by large variations of topography, more than 3.5 km, indicating significant erosion from the late Cenozoic paleosurface (Fig. 5). The overlap of areas of deep fjords, uplifted marine sediments, and high peaks above thin crust suggests erosion-driven uplift (Fig. 2). MODEL Our numerical model restores the pre-erosional situation in the Scoresbysund region and evaluates the amplitude of vertical motions of the isostatic response to the redistribution of material in the area. We aim to get a first-order estimate of the possible topographic uplift due to the bulk erosion in the region, while the detailed time evolution may be much more complex and should be considered in a separate study. In general, the model redistributes material by gradually filling up local concave shapes of the upper surface of the inland part of the model area with rocks of crustal density 2800 kg/m3, removing the corresponding mass of sediments with density of 2300 kg/m3 from the continental shelf, and replacing these sediments by water. The surface then adjusts 540 Figure 4. General view of effective topography of Scoresbysund region, with ice sheet replaced by crustal rock layer of same mass. Black isolines—depth of Moho (in km). Yellow lines A–A and B–B position profiles in Figure 5. isostatically using a model of the flexural isostasy (Watts, 2001) with a mantle density of 3300 kg/m3 and the lithosphere represented by an elastic plate with effective thickness of 20 km (Young’s modulus of 1011 Pa and Poisson ratio of 0.5). In contrast to the free edge plate model for the Antarctic margin of Stern et al. (2005), we consider a plate that continues throughout the model. We use uniform elastic thickness for the sake of simplicity. We developed a finite-element–based suite called ProShell to construct the model. We first designed a regular plane mesh (500 × 300 elements for an area of 900 × 500 km; Figs. 2–4 use this planar mesh for presenting the data) and then projected this mesh onto a spherical Earth model. This procedure resulted in a three-dimensional shell-plate finiteelement mesh. We separated the model domain into onshore and offshore subdomains (Fig. 6A). In our simplified model, we approximated GEOLOGY, July 2008 Figure 5. Variations of topography across two profiles from Figure 4. Thick black curves show actual effective topography (with ice replaced by same mass of rocks) along the profiles. Gray ribbons illustrate variations of topography within 60-km-wide corridor around corresponding profiles. Vertical dashed lines correspond to domain boundaries (see Fig. 3 for domain names). Note that variations of topography are much higher in the areas of Fjord Mountains and uplifted marine sediments. this division by smoothing out the modern coastal line. This approximation is perhaps the largest deviation from the geological evolution because shorelines may move in time. During each iteration, we alternated between two directions (eastwest and north-south) to find and gradually fill all cross-sectional inland concave shapes. We estimated the amount of material needed to fill the concave shapes located east from the drainage divide. We removed the same mass of material from the domain’s continental shelf. We then calculated the isostatic response to this mass redistribution using the mixed shear plate formulation (Kwon and Bang, 2000). The east and west boundaries of the plate were fixed, whereas the other sides slip free. The calculations were stopped when the surface was smooth and mass redistribution insignificant (Fig. 6B). Figure 6. General view of Scoresbysund region. A: Initial position (recent topography of the region. B: Final result of the model with smoothed topography and replaced offshore sediments. Yellow line indicates drainage divide and black line separates offshore and onshore parts of model. RESULTS Filling fjords and the surrounding highly eroded areas requires a significant amount of material, as much as 3 km thickness (Fig. 7A). The average material thickness needed to smooth out inland topography on the east from drainage divide is ~1.2 km. The isostatic response to this redistribution of material is presented in Figure 7B. The replacement of material resulted in significant subsidence of the inland coastal area, accounting for as much as 1.1 km. Most of the parameters used in the model are well established and can vary only slightly. However, the elastic thickness of the lithosphere cannot be estimated directly and it may affect results significantly. We varied elastic properties of the lithosphere in the model and found that thickness variations between 25 and 15 km result in only minor variations in the results (<100 m). Thus, the model cannot be used to estimate effective elastic thickness in the region. Other mechanisms, such as local deglaciation (Hansen, 2001), may be as efficient as variations of the elastic strength of the lithosphere in the region. If the elastic thickness is decreased down to 10 km, however, the result changes significantly, with local subsidence of 1.5 km beneath the Scoresbysund fjord. Nevertheless, even these large variations in results do not change the main conclusion of our study: erosion induced uplift is a major contributor to land formation in the region. The modeled isostatic response to erosion and deposition (Fig. 7) does not account for the loading and unloading caused by the Greenland ice sheet. We performed additional numerical experiments to estimate the influence of the ice sheet to 3 km in thickness. We found that although the inland load of ice may force up to 1.5 km of subsidence along the western boundary of the model, the edge effect of loading (bulging) is insignificant (up to 25 m) in the fjord area. An important model assumption is that the borders of the continental shelf domain do not change their position during the experiment. The other simplification is that the models do not tie the source to the sink with a predefined drainage pattern. As a consequence of that, more sediments were removed from the wide continental shelf in the north and more rocks were put into the large fjords in the south. The consequence of this is an underestimation of the subsidence of the northern part of marine sediments (Fig. 3). Two main features of our model differ from previous comparable studies elsewhere (e.g., in Antarctica and the EuropeanAlps; Champagnac et al., 2007; Stern et al., 2005). (1) Because we place rocks back over large areas (e.g., the Scoresbysund fjord is larger than any fjord in Antarctica and comparable to the characteristic wavelength of lithospheric bending), we consider dynamic interaction with isostasy. If rocks are placed back into the fjords in a single modeling event, the additional uneven isostatic subsidence caused by this load is ignored. In our iterative model this effect increases subsidence in the study area by ~10%. (2) The continental shelf adjacent to the study area is filled with sediments, which should be taken into account in mass redistribution. Although the effect of offshore sediment removal accounts for <5% of the changes in the subsidence of the fjord area, it does represent a more realistic geological scenario. The low sensitivity of the onshore response to the sediment removal reduces the importance of an accurate model for the sediment offshore GEOLOGY, July 2008 541 The North Atlantic and Arctic regions have been characterized by late Cenozoic vertical motions, active glacial erosion, and fjord systems (e.g., West Greenland; Japsen et al., 2006). Therefore, the results of our model may be applicable to the entire Arctic realm and perhaps to tectonically quiet coastal ranges globally. ACKNOWLEDGMENTS Reviews by J.-D. Champagnac, J. Chalmers, and editorial assistance of T. Niemi and G. Gisler significantly improved the manuscript. This work was supported by a Center of Excellence and Petromaks grants from the Norwegian Research Council to Physics of Geological Processes, University of Oslo. Medvedev also acknowledges support from a Euromargins grant to J.-I. Faleide and research grant from Aker Exploration. Figure 7. A: Amount of moved material includes placing of more than 3 km of rocks to smooth onshore part of model and more than 2 km of removed continental shelf. B: Isostatic response to that loading and unloading reaches more than 1 km of regional subsidence. placement in our study. That supports the simplifications adopted in our model, which resulted in an unrealistic box-like shape of the preerosional ocean floor (Fig. 6B). CONCLUSIONS Our numerical exercises show that redistribution of material by putting the eroded material back to its original position may result in the isostatic subsidence of coastal areas by 1.1 km. Time reversal of this may represent a plausible model of how the landscape evolved onto today’s form, thereby explaining uplift of the Fjord Mountains and the Mesozoic marine sediments by ~1.1 km, as a result of unloading the area as the fjords formed. This uplift is caused by flexural response to localized erosion and is generally not fully supported by local isostasy. The difference between flexural and local isostasy can be estimated from the results of our model (Fig. 7) and is comparable in magnitude to the unspecified tectonic uplift from thermochronological and one-dimensional isostatic modeling of Mathiesen et al. (2000). Even though our model is based on several simplifications, the estimation of the regional uplift by erosion is robust and based on conservative parameters. Thus we may conclude that the active erosion of the region is the first-order feature responsible for significant uplift of the marine sediments and adjacent Fjord Mountains. The model also estimates the mass balance between erosion and sedimentation in the region. We can conclude that the major part of eroded material is stored on the adjacent continental shelf. If the estimations of the age of the sediments offshore Scoresbysund by Hamann et al. (2005) are correct, then the major part of erosion and, correspondingly, land formation happened during the past 5 m.y. Thus, our study can contribute to discussion on the worldwide increased erosion and sedimentation rates during the late Cenozoic (e.g., Molnar and England, 1990; Hay et al., 2002). 542 REFERENCES CITED Bamber, J.L., Layberry, R.L., and Gogineni, S., 2001, A new ice thickness and bed data set for the Greenland ice sheet 1. Measurement, data reduction, and errors: Journal of Geophysical Research, v. 106, no. D24, p. 33,773–33,780, doi: 10.1029/2001JD900054. Champagnac, J.D., Molnar, P., Anderson, R.S., Sue, C., and Delacou, B., 2007, Quaternary erosion-induced isostatic rebound in the western Alps: Geology, v. 35, p. 195–198, doi: 10.1130/G23053A.1. Haller, J., 1971, Geology of the East Greenland Caledonides: London, New York, Interscience, 413 p. Hamann, N.E., Whittaker, R.C., and Stemmerik, L., 2005, Geological development of the Northeast Greenland Shelf, in Doré, A.G., and Vining, B., eds., Petroleum geology: North-west Europe and global perspectives: Proceedings of the 6th Petroleum Conference, Geological Society [London], Bath: Geological Society [London], p. 887–902. Hansen, L., 2001, Landscape and coast development of a lowland fjord margin following deglaciation, East Greenland: Geografiska Annaler, ser. A, Physical Geography, v. 83A, p. 131–144. Hay, W.W., Soeding, E., DeConto, R.M., and Wold, C.N., 2002, The late Cenozoic uplift—Climate change paradox: International Journal of Earth Sciences, v. 91, p. 746–774, doi: 10.1007/s00531–002–0263–1. Henriksen, N., Higgins, A.K., Kalsbeek, F., and Pulvertaft, T.C.R., 2000, Greenland from Archaean to Quaternary: Geological map of Greenland, 1:2 500 000: Geology of Greenland Survey Bulletin, v. 185, 93 p. Japsen, P., Bonow, M.B., Green, P.F., Chalmers, J.A., and Lidmar-Bergström, K., 2006, Elevated, passive continental margins: Long-term highs or Neogene uplifts? New evidence from West Greenland: Earth and Planetary Science Letters, v. 248, p. 330–339, doi: 10.1016/j.epsl.2006.05.036. Kwon, Y.W., and Bang, H., 2000, The finite element method using MATLAB: Boca Raton, Florida, CRC Press, 607 p. Mathiesen, A., Bidstrup, T., and Christiansen, F.G., 2000, Denudation and uplift history of the Jameson Land basin, East Greenland—Constrained from maturity and apatite fission track data: Global and Planetary Changes, v. 24, p. 275–301. Molnar, P., and England, P., 1990, Late Cenozoic uplift of mountain ranges and global climate change—Chicken or egg?: Nature, v. 346, p. 29–34, doi: 10.1038/346029a0. Montgomery, D.R., 1994, Valley incision and the uplift of mountain peaks: Journal of Geophysical Research, v. 99, no. B7, p. 13,913–13,921, doi: 10.1029/94JB00122. Odell, N.E., 1937, The glaciers and morphology of the Franz Josef Fjord region of north-east Greenland: Geographical Journal, v. 90, p. 111–125, doi: 10.2307/1787126. Pelletier, J.D., 2004, Estimate of three-dimensional flexural-isostatic response to unloading: Rock uplift due to late Cenozoic glacial erosion in the western United States: Geology, v. 32, p. 161–164, doi: 10.1130/G20059.1. Schmidt-Aursch, M.C., and Jokat, W., 2005, The crustal structure of central East Greenland—II: From the Precambrian shield to the recent midoceanic ridges: Geophysical Journal International, v. 160, p. 753–760, doi: 10.1111/j.1365–246X.2005.02515.x. Stern, T.A., Baxter, A.K., and Barrett, P.J., 2005, Isostatic rebound due to glacial erosion within the Transantarctic Mountains: Geology, v. 33, p. 221–224, doi: 10.1130/G21068.1. Watts, A.B., 2001, Isostasy and flexure of the lithosphere: Cambridge, New York, Cambridge University Press, 458 p. Manuscript received 20 November 2007 Revised manuscript received 14 March 2008 Manuscript accepted 22 March 2008 Printed in USA GEOLOGY, July 2008
