Oil Pollution in Newfoundland Impacts on Seabirds by Stan Tobin
advertisement
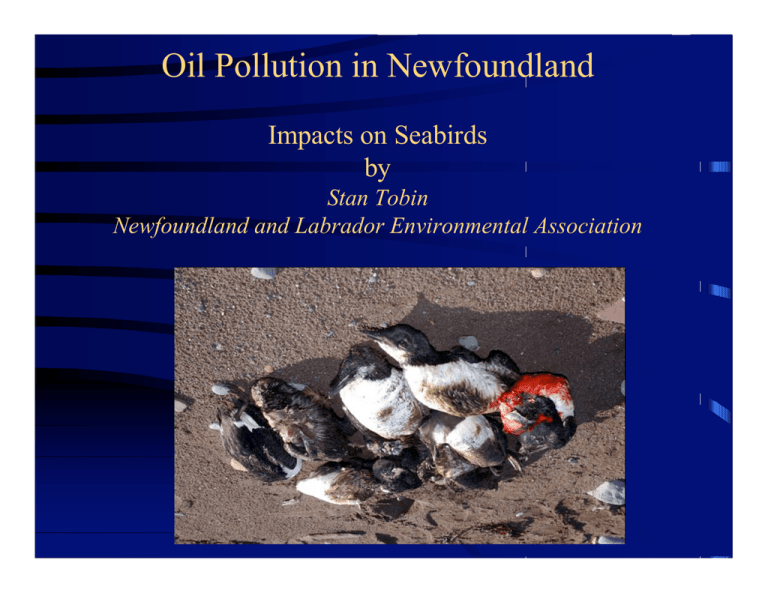
Oil Pollution in Newfoundland Impacts on Seabirds by Stan Tobin Newfoundland and Labrador Environmental Association Newfoundland and Labrador Environmental Association • Nonprofit Association • Mandate of environmental conservation • Focused on marine areas • Actively involved in monitoring oil pollution Long History of Involvement in Oil Pollution Prevention • In 1990, member of the ‘Brandersmith’ panel on tanker safety and marine spills • 107 recommendations with > 90 now implemented • Did not effectively address chronic oil pollution • Member of the Regional Advisory Committee NLEA Actively Involved • Maintains beach monitoring for past 15 years • Collects scientific data for industry • Lobbies Government and interfaces with media Chronic Oil Pollution the Major Problem • 300,000 seabirds dying annually • Equivalent of an Exxon Valdez each year • Mystery spills from shipsource oil waste (esp. bilge flushing) • Potential for major oil spills is high and recent increase in offshore (drilling) incidents NLEA Operates the Only Rehabilitation Centre in Newfoundland • Established in 1996 • Operated on volunteer basis • Capacity and technology improving • Ultimate benefits unproven Poor Record of Prosecution • Judicial system is ‘soft’ • Fines are relatively low • Offshore industry selfpolicing • Interdepartmental mandate conflicts - who enforces?? Scientific Capacity Extremely Poor • No knowledge of status and trends of seabird populations • Ability to link oil on feathers to ship source not proven • ‘Fingerprinting’ technology (chromatography) is outdated • Need innovation, e.g. mass spectrometry • Gov’t of Canada not monitoring populations or impacts Problems Increasing In Magnitude • Proportion of ‘beached birds’ oiled continues to increase • Mortality due to oiling is in addition to large annual hunter kills (2-300,000) • Oil tanker traffic increased in environmentally sensitive areas (Placentia Bay) • Offshore oil extraction having significant spills but cannot be directly monitored Proportion Corpses Oiled 0.9 0.8 0.7 0.6 0.5 0.4 0.3 0.2 0.1 0 1950 1960 1970 1980 1990 2000 2010 Drastic Need For Improvements • Focus On Prevention • Increased Surveillance and Fines (Transport Canada) • Established Seabird Monitoring Programs (Environment Canada) • Increased Partnership With Industry
