Earthquake Exercises GY 111 Physical Geology
Name: _______________________________ Due Thursday November 12, 2015
GY 111 Physical Geology
(worth 35 points)
Earthquake Exercises
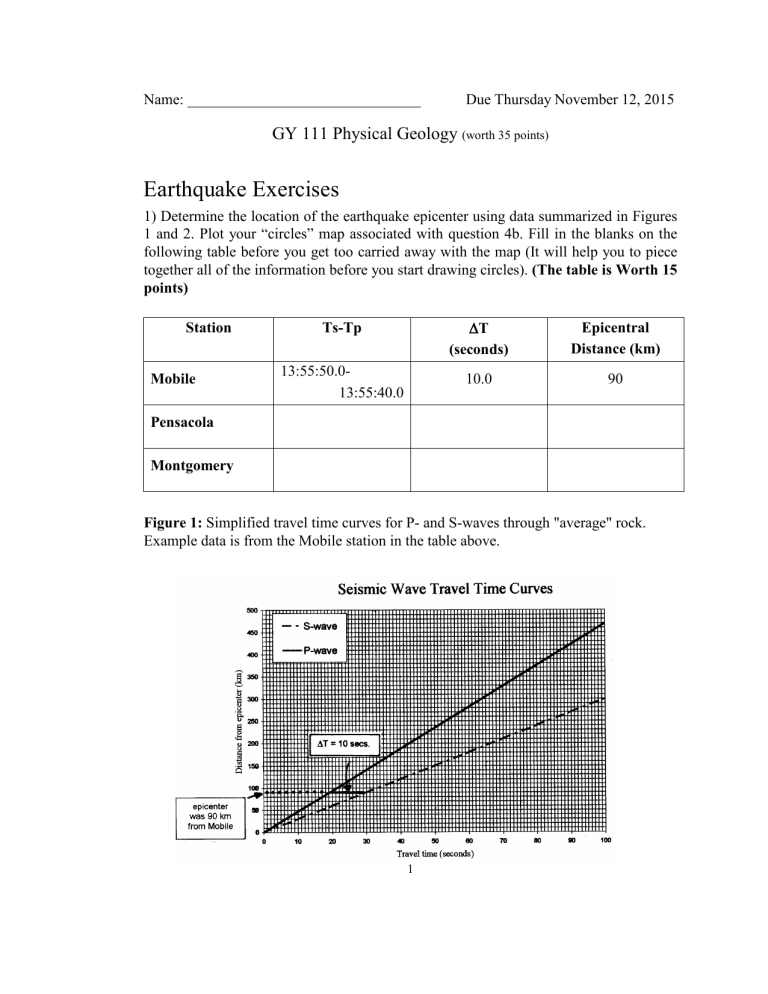
1) Determine the location of the earthquake epicenter using data summarized in Figures
1 and 2. Plot your “circles” map associated with question 4b. Fill in the blanks on the following table before you get too carried away with the map (It will help you to piece together all of the information before you start drawing circles). (The table is Worth 15 points)
Station Ts-Tp
∆
T Epicentral
(seconds) Distance (km)
Mobile
13:55:50.0-
13:55:40.0
10.0 90
Pensacola
Montgomery
Figure 1: Simplified travel time curves for P- and S-waves through "average" rock.
Example data is from the Mobile station in the table above.
1
Figure 2: Schematic seismograms from three fictitious seismograph stations in the Gulf
Coast region. Time clicks are indicated by periodic upward deflections in the trace. The first (13:55:00) is used to synchronize all three of the stations. Refer to the faults on-line help pages (on the class website) for additional explanation of these diagrams.
2
2) Using the county map of the southeastern United States, determine the location of the epicenter of the earthquake. Be sure to label the location of the epicenter on the map
(It’s worth 15 points)
3) In which county was the epicenter of the earthquake?_________________( 5 points)
3
