STAT 557 Instructions:
advertisement
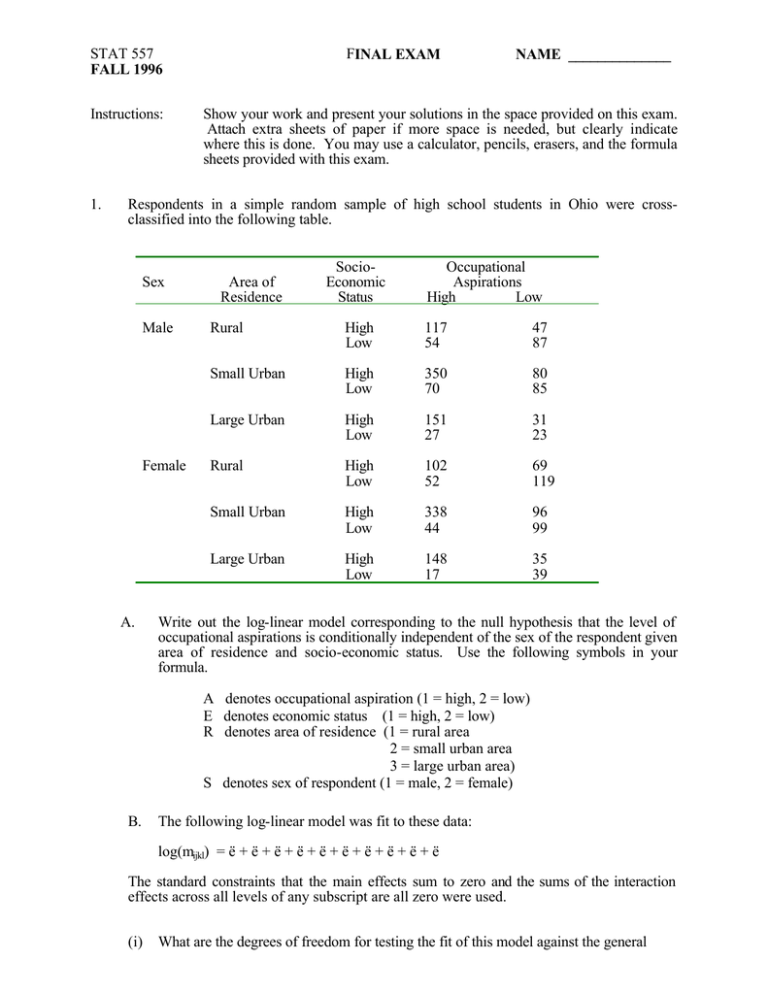
STAT 557 FALL 1996 Instructions: 1. FINAL EXAM NAME ______________ Show your work and present your solutions in the space provided on this exam. Attach extra sheets of paper if more space is needed, but clearly indicate where this is done. You may use a calculator, pencils, erasers, and the formula sheets provided with this exam. Respondents in a simple random sample of high school students in Ohio were crossclassified into the following table. Sex Male Female A. Area of Residence SocioEconomic Status Occupational Aspirations High Low Rural High Low 117 54 47 87 Small Urban High Low 350 70 80 85 Large Urban High Low 151 27 31 23 Rural High Low 102 52 69 119 Small Urban High Low 338 44 96 99 Large Urban High Low 148 17 35 39 Write out the log-linear model corresponding to the null hypothesis that the level of occupational aspirations is conditionally independent of the sex of the respondent given area of residence and socio-economic status. Use the following symbols in your formula. A denotes occupational aspiration (1 = high, 2 = low) E denotes economic status (1 = high, 2 = low) R denotes area of residence (1 = rural area 2 = small urban area 3 = large urban area) S denotes sex of respondent (1 = male, 2 = female) B. The following log-linear model was fit to these data: log(mijkl) = ë + ë + ë + ë + ë + ë + ë + ë + ë + ë The standard constraints that the main effects sum to zero and the sums of the interaction effects across all levels of any subscript are all zero were used. (i) What are the degrees of freedom for testing the fit of this model against the general 2 alternative? (ii) All terms in this model are significant and this model fits the data well. What does this imply about independence or associations among the four factors: occupational aspirations (A), socio-economic status (E), area of residence (R), and sex of respondent (S)? (iii) Maximum likelihood estimates of the and terms are shown below. Estimate Std. errors = 0.416 = −.091 = .044 .027 .036 .034 Describe what these estimates reveal about the association between occupational aspirations and socio-economic status among high school students? C. Using occupational aspirations (A) as the response variable, show how the model in part (B) would be written as a logistic regression model. Just give a formula for the logistic regression model, do not try to obtain numerical values for parameters in the logistic regression model. 2. Forty corn fields were examined in a study to determine if the species of grass growing along the borders of the fields affect the average number of larvae of a certain insect species found in corn plants. Grass species A grew along the borders of 20 of these fields and grass species B grew along the borders of the other 20 fields. In each field, 20 corn plants were randomly selected from the plants growing at a distance of 3 meters from the borders of the field. The total number of larvae found in these 20 plants (Y) was counted. This produced a set of 40 counts, one count for each field. The researchers also recorded the mean daily temperature (T) and the mean daily rain fall (R) during the previous 30 days in each field. Temperature and rainfall are known to affect the number of larvae present in corn fields. Explain how you would determine if the type of grass growing along the border of the field has any association with the mean number of insect larvae in corn plants growing 3 meters from the boundaries. Outline the steps you would take in performing a test or developing a model. Show formulas for tests or models you would use. 3. In a study of parental attitudes toward violence in movies, a random sample of n=400 families was taken out of the population of families in Iowa that have a father, a mother, and a boy in high school. After watching a certain movie with some violent content, each member of the family was asked if the movie was too violent for viewing by teenagers. Responses were coded as Yes for too violent for teenagers No for suitable for viewing by teenagers Show how you would construct 95% confidence intervals for 4. A. The proportion of teenage boys who think the film is too violent for viewing by teenagers. B. The difference in proportions of fathers and mothers who think the film is too violent for viewing by teenagers. By mailing offers to a large number of people, a bank was able to add 14,565 new credit 3 cards users to its business. After two years, 762 of these credit card users had defaulted on their loans. These people were classified as "bad" outcomes, their credit card was taken away, and their debt written off as a loss to the bank. The other 13,803 customers were classified as "good" outcomes. In a first attempt to develop a model for predicting "bad" loans, the following logist regression model was fit: π log i = â0 + â1 X1i 1 − πi i = 1, 2, ..., 14565 where X1i is a value of a composite score of financial variables (called the FICO score) for the i-th individual when their credit card was first issued and ði is the conditional probability of a "bad" outcome within the first two years. Use the computer output on page 6 to help answer the following questions. 5. A. Given that the maximum likelihood estimate for â1 is reported as 1 = −.488, explain how you would interpret the association between the conditional probability of a "bad" outcome and the FICO score at the time when the credit card was first issued. B. Give a formula for the log-likelihood function that was maximized to get the estimate in part A. C. Carefully state the probability model that yields the log-likelihood function you stated in part B. D. What does the concordant = 49.2% result on the output measure? Explain how you would interpret the Gamma = .076 result. E. The FICO values in the data set range from 6.4 through 8.2. Evaluate the maximum likelihood estimate of ð, the conditional probability of a "bad" outcome when the FICO score is 6.6. F. Construct a 95% confidence interval for the conditional probability of a "bad" outcome when the FICO score is 6.6. The data set form problem 3 actually contains seven explanatory variables that can be used to estimate the probability of a "bad" outcome. The variables are X1 X2 FICO score when credit card is first issued Number of trade lines opened in the first 6 months X3 Total high credits X4 (loan balance)/(credit limit) ratio X5 Time since most recent trade line was opened X6 (FICO score at mailing) − (FICO score when card is issued) X7 total number of trades The maximum likelihood estimate of formula for the logistic regression model selected by one researcher is 4 π log i = 1.147 1 − πi (.975) –1.08X6 (.100) – 0.592X1 (.140) – + 0.199X2 + .00129X4 (.053) (.00043) .0589X7 (.0133) A. A local mean deviance plot for this model is shown on page 10. Explain how such a plot is constructed. B. What does this local mean deviance plot tell you about the data and the model shown above. C. Partial residual plots for this model are also shown on page 10 of this exam. Describe what these plots reveal? EXAM SCORE COURSE GRADE
