Math 3070 § 1. Programming: Loops, Functions Name: Example
advertisement
Math 3070 § 1.
Treibergs
Programming: Loops, Functions
Name:
Example
May 20, 2011
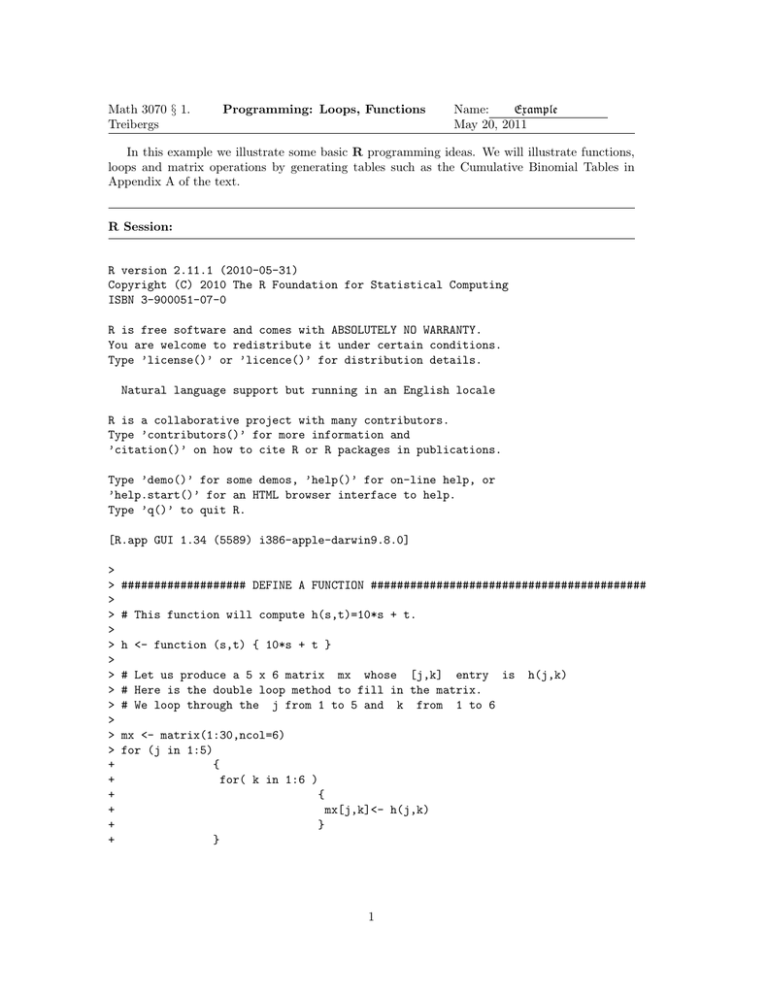
In this example we illustrate some basic R programming ideas. We will illustrate functions,
loops and matrix operations by generating tables such as the Cumulative Binomial Tables in
Appendix A of the text.
R Session:
R version 2.11.1 (2010-05-31)
Copyright (C) 2010 The R Foundation for Statistical Computing
ISBN 3-900051-07-0
R is free software and comes with ABSOLUTELY NO WARRANTY.
You are welcome to redistribute it under certain conditions.
Type ’license()’ or ’licence()’ for distribution details.
Natural language support but running in an English locale
R is a collaborative project with many contributors.
Type ’contributors()’ for more information and
’citation()’ on how to cite R or R packages in publications.
Type ’demo()’ for some demos, ’help()’ for on-line help, or
’help.start()’ for an HTML browser interface to help.
Type ’q()’ to quit R.
[R.app GUI 1.34 (5589) i386-apple-darwin9.8.0]
>
>
>
>
>
>
>
>
>
>
>
>
>
+
+
+
+
+
+
################### DEFINE A FUNCTION ##########################################
# This function will compute h(s,t)=10*s + t.
h <- function (s,t) { 10*s + t }
# Let us produce a 5 x 6 matrix mx whose [j,k] entry is
# Here is the double loop method to fill in the matrix.
# We loop through the j from 1 to 5 and k from 1 to 6
mx <- matrix(1:30,ncol=6)
for (j in 1:5)
{
for( k in 1:6 )
{
mx[j,k]<- h(j,k)
}
}
1
h(j,k)
> mx
[,1] [,2] [,3] [,4] [,5] [,6]
[1,]
11
12
13
14
15
16
[2,]
21
22
23
24
25
26
[3,]
31
32
33
34
35
36
[4,]
41
42
43
44
45
46
[5,]
51
52
53
54
55
56
>
> # R is a vector oriented language. There are vector short cuts.
> # outer(x,y,"f") takes vectors x,y of lengths l,m and produces an l x m matrix
> # whose [j,k] entry is f(x[j],y[k]). (Same as the double loop above!)
>
> outer(1:5,1:6,"h")
[,1] [,2] [,3] [,4] [,5] [,6]
[1,]
11
12
13
14
15
16
[2,]
21
22
23
24
25
26
[3,]
31
32
33
34
35
36
[4,]
41
42
43
44
45
46
[5,]
51
52
53
54
55
56
>
> ########################### TABLES OF PROBABILITIES ##################################
>
> # The cumulative Poisson Probability is called ppois(x,lambda).
> hh <- function (s,t) { ppois(s,t) }
>
> # Let’s make a table with x from 0 to 5 and lambda from .125 to 1 by eigths.
> x <- 0:5; y <- (1:8)/8; x; y
[1] 0 1 2 3 4 5
[1] 0.125 0.250 0.375 0.500 0.625 0.750 0.875 1.000
> outer(x,y,"hh")
[,1]
[,2]
[,3]
[,4]
[,5]
[,6]
[,7]
[,8]
[1,] 0.8824969 0.7788008 0.6872893 0.6065307 0.5352614 0.4723666 0.4168620 0.3678794
[2,] 0.9928090 0.9735010 0.9450228 0.9097960 0.8697998 0.8266415 0.7816163 0.7357589
[3,] 0.9997035 0.9978385 0.9933478 0.9856123 0.9743431 0.9594946 0.9411963 0.9196986
[4,] 0.9999908 0.9998666 0.9993884 0.9982484 0.9961229 0.9927078 0.9877404 0.9810118
[5,] 0.9999998 0.9999934 0.9999547 0.9998279 0.9995260 0.9989353 0.9979220 0.9963402
[6,] 1.0000000 0.9999997 0.9999972 0.9999858 0.9999514 0.9998694 0.9997037 0.9994058
>
2
>
>
>
>
>
>
>
>
>
>
>
>
>
>
y
>
#
#
#
#
#
Let us make sequence of tables for Cumulative Binomial Probabilities
for n running from 2 to 8 and printing the fifteen values of p
as x runs from 0 to n. The Cumulative Binomial Probability is called
pbinom(x, n, p) where x is the number of successes in n trials whose prob
of success is p.
# round() rounds the value to the given number of digits. (To fit it all on the page!)
# I’ve named the matrix tbl. To jazz it up, if named the cols and rows print.
# The columns are named by the numbers of y and the rows by x.
# cat() writes the string concatenating the listed alphabetic and numerical values.
# \n is the "next line" character and "\\" is the backslash.
# print() outputs the tables from within the loop.
# y is given the values for prob of success p as in the text.
#
<- c(.01,.05,.1,.2,.25,.3,.4,.5,.6,.7,.75,.8,.9,.95,.99)
y
[1] 0.01 0.05 0.10 0.20 0.25 0.30 0.40 0.50 0.60 0.70 0.75 0.80 0.90 0.95 0.99
>
> for( i in 2:8){
+
x<- 0:(i-1)
+
gg <- function(s,t) round(pbinom(s,i,t),3)
+
tbl <- outer(x,y,"gg")
+
rownames(tbl)<- x
+
colnames(tbl) <- y
+
cat("\n","x \\ p
CUMULATIVE BINOMIAL PROBABILITIES.
+
print(tbl)
+
}
n = ",i,"\n")
x \ p
CUMULATIVE BINOMIAL PROBABILITIES.
n = 2
0.01 0.05 0.1 0.2 0.25 0.3 0.4 0.5 0.6 0.7 0.75 0.8 0.9 0.95 0.99
0 0.98 0.902 0.81 0.64 0.563 0.49 0.36 0.25 0.16 0.09 0.063 0.04 0.01 0.003 0.00
1 1.00 0.998 0.99 0.96 0.938 0.91 0.84 0.75 0.64 0.51 0.437 0.36 0.19 0.098 0.02
x \ p
CUMULATIVE BINOMIAL PROBABILITIES.
n
0.01 0.05
0.1
0.2 0.25
0.3
0.4
0.5
0 0.97 0.857 0.729 0.512 0.422 0.343 0.216 0.125
1 1.00 0.993 0.972 0.896 0.844 0.784 0.648 0.500
2 1.00 1.000 0.999 0.992 0.984 0.973 0.936 0.875
x \ p
0.01
0 0.961
1 0.999
2 1.000
3 1.000
=
3
0.6
0.7 0.75
0.8
0.9 0.95 0.99
0.064 0.027 0.016 0.008 0.001 0.000 0.00
0.352 0.216 0.156 0.104 0.028 0.007 0.00
0.784 0.657 0.578 0.488 0.271 0.143 0.03
CUMULATIVE BINOMIAL PROBABILITIES.
n = 4
0.05
0.1
0.2 0.25
0.3
0.4
0.5
0.6
0.815 0.656 0.410 0.316 0.240 0.130 0.062 0.026
0.986 0.948 0.819 0.738 0.652 0.475 0.313 0.179
1.000 0.996 0.973 0.949 0.916 0.821 0.688 0.525
1.000 1.000 0.998 0.996 0.992 0.974 0.938 0.870
3
0.7
0.008
0.084
0.348
0.760
0.75
0.004
0.051
0.262
0.684
0.8
0.002
0.027
0.181
0.590
0.9
0.000
0.004
0.052
0.344
0.95
0.000
0.000
0.014
0.185
0.99
0.000
0.000
0.001
0.039
x \ p
0.01
0 0.951
1 0.999
2 1.000
3 1.000
4 1.000
CUMULATIVE BINOMIAL PROBABILITIES.
n = 5
0.05
0.1
0.2 0.25
0.3
0.4
0.5
0.6
0.774 0.590 0.328 0.237 0.168 0.078 0.031 0.010
0.977 0.919 0.737 0.633 0.528 0.337 0.187 0.087
0.999 0.991 0.942 0.896 0.837 0.683 0.500 0.317
1.000 1.000 0.993 0.984 0.969 0.913 0.812 0.663
1.000 1.000 1.000 0.999 0.998 0.990 0.969 0.922
0.7
0.002
0.031
0.163
0.472
0.832
0.75
0.001
0.016
0.104
0.367
0.763
0.8
0.000
0.007
0.058
0.263
0.672
0.9
0.000
0.000
0.009
0.081
0.410
0.95
0.000
0.000
0.001
0.023
0.226
0.99
0.000
0.000
0.000
0.001
0.049
x \ p
0.01
0 0.941
1 0.999
2 1.000
3 1.000
4 1.000
5 1.000
CUMULATIVE BINOMIAL PROBABILITIES.
n = 6
0.05
0.1
0.2 0.25
0.3
0.4
0.5
0.6
0.735 0.531 0.262 0.178 0.118 0.047 0.016 0.004
0.967 0.886 0.655 0.534 0.420 0.233 0.109 0.041
0.998 0.984 0.901 0.831 0.744 0.544 0.344 0.179
1.000 0.999 0.983 0.962 0.930 0.821 0.656 0.456
1.000 1.000 0.998 0.995 0.989 0.959 0.891 0.767
1.000 1.000 1.000 1.000 0.999 0.996 0.984 0.953
0.7
0.001
0.011
0.070
0.256
0.580
0.882
0.75
0.000
0.005
0.038
0.169
0.466
0.822
0.8
0.000
0.002
0.017
0.099
0.345
0.738
0.9
0.000
0.000
0.001
0.016
0.114
0.469
0.95
0.000
0.000
0.000
0.002
0.033
0.265
0.99
0.000
0.000
0.000
0.000
0.001
0.059
x \ p
0.01
0 0.932
1 0.998
2 1.000
3 1.000
4 1.000
5 1.000
6 1.000
CUMULATIVE BINOMIAL PROBABILITIES.
n = 7
0.05
0.1
0.2 0.25
0.3
0.4
0.5
0.6
0.698 0.478 0.210 0.133 0.082 0.028 0.008 0.002
0.956 0.850 0.577 0.445 0.329 0.159 0.063 0.019
0.996 0.974 0.852 0.756 0.647 0.420 0.227 0.096
1.000 0.997 0.967 0.929 0.874 0.710 0.500 0.290
1.000 1.000 0.995 0.987 0.971 0.904 0.773 0.580
1.000 1.000 1.000 0.999 0.996 0.981 0.938 0.841
1.000 1.000 1.000 1.000 1.000 0.998 0.992 0.972
0.7
0.000
0.004
0.029
0.126
0.353
0.671
0.918
0.75
0.000
0.001
0.013
0.071
0.244
0.555
0.867
0.8
0.000
0.000
0.005
0.033
0.148
0.423
0.790
0.9
0.000
0.000
0.000
0.003
0.026
0.150
0.522
0.95
0.000
0.000
0.000
0.000
0.004
0.044
0.302
0.99
0.000
0.000
0.000
0.000
0.000
0.002
0.068
x \ p
0.01
0 0.923
1 0.997
2 1.000
3 1.000
4 1.000
5 1.000
6 1.000
7 1.000
>
CUMULATIVE BINOMIAL PROBABILITIES.
n = 8
0.05
0.1
0.2 0.25
0.3
0.4
0.5
0.6
0.663 0.430 0.168 0.100 0.058 0.017 0.004 0.001
0.943 0.813 0.503 0.367 0.255 0.106 0.035 0.009
0.994 0.962 0.797 0.679 0.552 0.315 0.145 0.050
1.000 0.995 0.944 0.886 0.806 0.594 0.363 0.174
1.000 1.000 0.990 0.973 0.942 0.826 0.637 0.406
1.000 1.000 0.999 0.996 0.989 0.950 0.855 0.685
1.000 1.000 1.000 1.000 0.999 0.991 0.965 0.894
1.000 1.000 1.000 1.000 1.000 0.999 0.996 0.983
0.7
0.000
0.001
0.011
0.058
0.194
0.448
0.745
0.942
0.75
0.000
0.000
0.004
0.027
0.114
0.321
0.633
0.900
0.8
0.000
0.000
0.001
0.010
0.056
0.203
0.497
0.832
0.9
0.000
0.000
0.000
0.000
0.005
0.038
0.187
0.570
0.95
0.000
0.000
0.000
0.000
0.000
0.006
0.057
0.337
0.99
0.000
0.000
0.000
0.000
0.000
0.000
0.003
0.077
4

