GCSE Mathematics Extension Material HD 3 Tree diagrams
advertisement
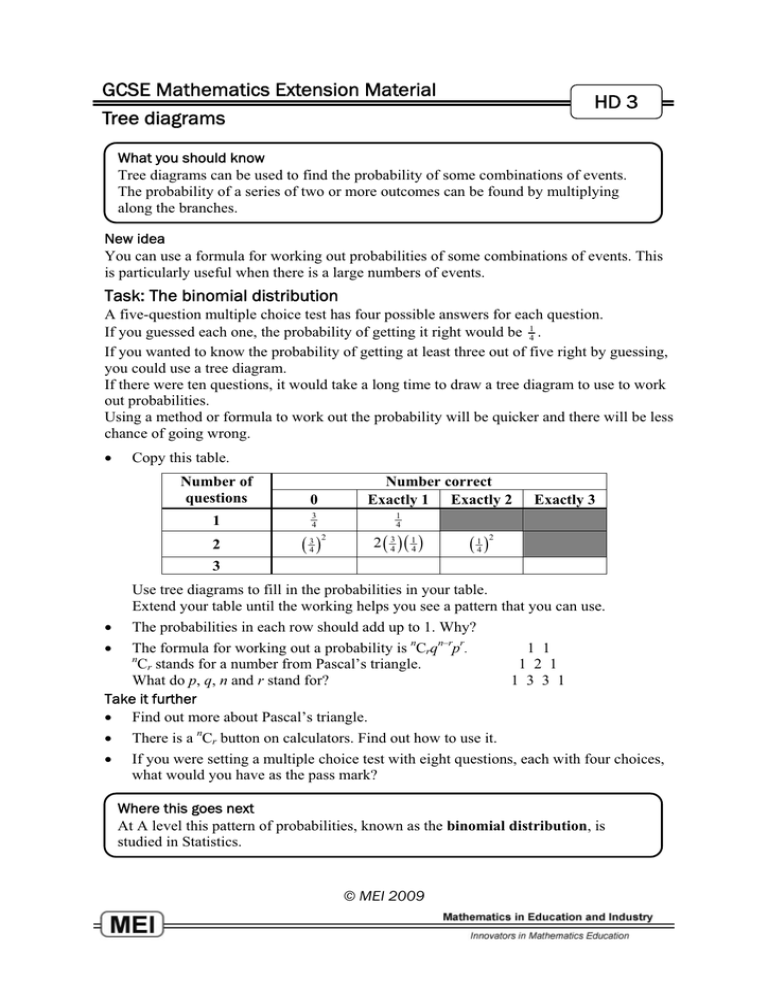
GCSE Mathematics Extension Material HD 3 Tree diagrams What you should know Tree diagrams can be used to find the probability of some combinations of events. The probability of a series of two or more outcomes can be found by multiplying along the branches. New idea You can use a formula for working out probabilities of some combinations of events. This is particularly useful when there is a large numbers of events. Task: The binomial distribution A five-question multiple choice test has four possible answers for each question. If you guessed each one, the probability of getting it right would be 14 . If you wanted to know the probability of getting at least three out of five right by guessing, you could use a tree diagram. If there were ten questions, it would take a long time to draw a tree diagram to use to work out probabilities. Using a method or formula to work out the probability will be quicker and there will be less chance of going wrong. x Copy this table. Number of questions 0 1 3 4 2 34 Number correct Exactly 1 Exactly 2 Exactly 3 1 4 2 2 34 14 14 2 3 Use tree diagrams to fill in the probabilities in your table. Extend your table until the working helps you see a pattern that you can use. x The probabilities in each row should add up to 1. Why? x The formula for working out a probability is nCrqn–rpr. 1 1 n Cr stands for a number from Pascal’s triangle. 1 2 1 What do p, q, n and r stand for? 1 3 3 1 Take it further x Find out more about Pascal’s triangle. x There is a nCr button on calculators. Find out how to use it. x If you were setting a multiple choice test with eight questions, each with four choices, what would you have as the pass mark? Where this goes next At A level this pattern of probabilities, known as the binomial distribution, is studied in Statistics. © MEI 2009
