C R SOUTHWEST Forest and
advertisement
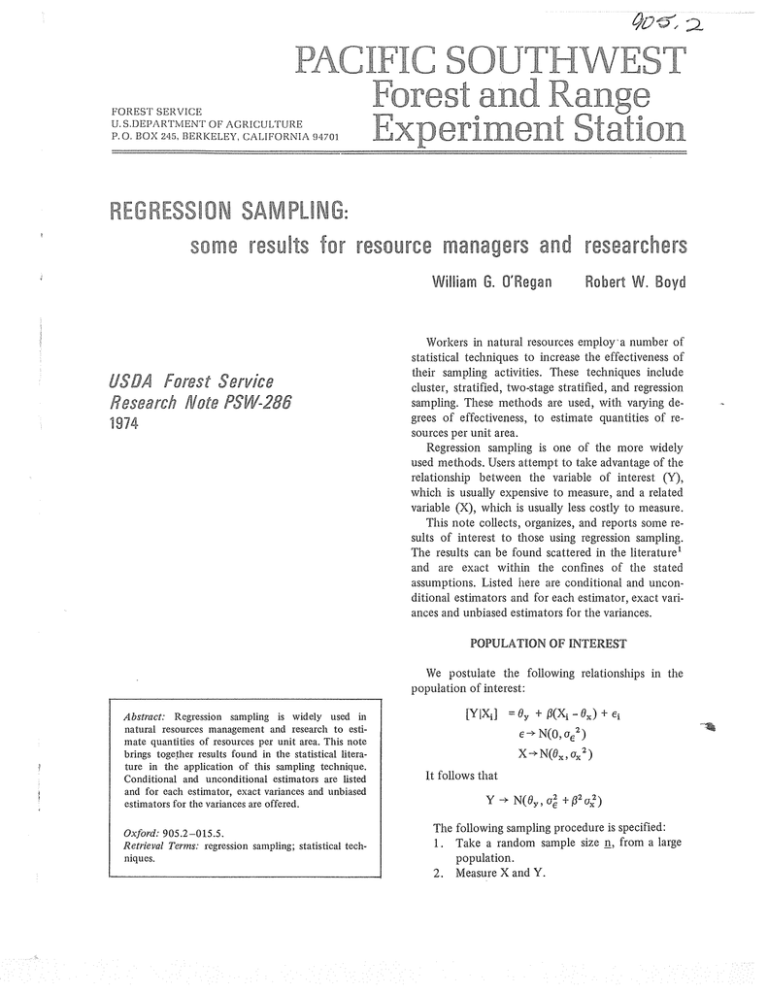
F O R E S T SERVICE U. S.DEPARTMENT OF' AGRICULTURE P . 0 . E O X 245, BERKELEY, CALIFORNIA 94701 C SOUTHWEST Forest and R Experirne REGRESSION SAMPLING: some results for resource managers and researchers William USBA Foresf Se~vice Research Note PSW-286 "1974 G. O'Regan Robert W. Boyd Worlters in natural resources employ'a number of statistical techniques to increase the effectiveness of their sampling activities. These techniques include cluster, stratified, two-stage stratified, and regression sampling. These methods are used, with varying degrees of effectiveness, to estimate quantities of resources per unit area. Regression sampling is one of the more widely used methods. Users attempt to take advantage of the relationship between the variable of interest (Y), which is usually expensive to measure, and a related variable (X), which is usually less costly to measure. This note collects, organizes, and reports some results of interest to those using regression sampling. The results can be found scattered in the literature' and are exact within the confines of the stated assumptions. Listed here are conditional and unconditional estimators and for each estimator, exact variances and unbiased estimators for the variances. POPULATION OF INTEREST We postulate the following relationships in the population of interest: Abstract: Regression sampling is widely used in natural resources management and research to estimate quantities of resources per unit area. This note brings together results found in the statistical literature in the application of this sampling technique. Conditional and unconditional estimators are listed and for each estimator, exact variances and unbiased estimators for the variances are offered. Oxford: 905.2-015.5. Retrieval Terms: regression sampling; statistical techniques. [YlXi] = 0, + 0(Xi - 0,) + ei e-+ N(O, of2) X+N(ox, ox2) It follows that The following sampling procedure is specified: 1. Take a random sample size 11, from a large population. 2. Measure X and Y. 3. Calculate Y ,p, and X, estimates of 6,,/3, and 6,. =cY/n % =cx/n p = cxy/cx2 in which x-x =Y-U x = y 4. For a value of X, say X*, use as the estimated value of Y. 5. When X* is random, it is considered to be the mean of N independent, random observations on X, i.e., 6. When X* is not random it is a fixed value of X. In some situations, Questions about the expected value and variance of Y* can be answered only within the context of the sampling distribution of Y*. This distribution depends upon the nature of the "repeated sampling" that gives rise to the sampling distribution. There are four possibilities, or cases, with two additional special cases: (1) The n X's in the first sample (a set, S1) and X* are considered fixed in the repeated samples; i.e., only the n Y's vary. (1 s) Same as 1, except that X*=6,. (2) S1 and the Y's vary, while X* is fixed. h which case (2s) Same as 2, except that X*=O,. (3) S1 is fixed, while the n Y's and X* are random, and (4) S, ,X*, and the n Y's all vary in repeated samples. Expected values, variances, and unbiased estimates of the variance of Y* for each of these specifications are listed in table 1. CHOICE OF MODELS The choice of models is a subject matter problem-not a statistical problem. How the values, variances, and estimated variances listed in table 1 are used will depend on which specification describes the subject matter problem. Furthermore, the user should remember the normality and independence assumptions, that n and N are fixed sample sizes, that "given S1, X'$" means that only the n observations on Y are conceived of as varying in repeated samples, and that "given X*" means that the n observations of paired X,Y are variable. "Given X*" indicates that the estimate is for some arbitrary value of X=X*: (sometimes X"=6, ;that is, the mean of the distribution of Xi is known). Obviously, "given S1" implies that the n observations on U and the N observations on X vary from sample to sample. The applicability of these specifications depends upon the problem at hand (table 1). The validity of the entries in columns 3 , 4 , and 5 of table 1 can be demonstrated: The relationships in which X and Y are random variables are used throughout these demonstrations. We know E(1IxE) = l/(p -2) and E(FP,,) = q/(q-2). From the specifications, All variables in this development are to be assumed subscripted by i. All summations are over i (i=l, 2 , . . .,n). Therefore, we omit all limits of summation. Then, Table 1-Expected values, variances, and estimated variancesfor Y* (the estimated value in regression sampli~zg), for different specifications' VV*) Cases Specifications E(Y *) (1 S1, X* fixed 0, t P(X*-0,) a: [ l / n t ( x * - % ) ~ / z x ~ ] 6: [ I /n (1 s) S1 fixed; X* = 0, OY a: [ l / n + (0x-%)2/C~2] % [ l / n + ( O , - X ) ~ / C X]~ (2) S1 random, XY'fixed [a: /(n-3)] [(n-2)/n 6; [I 111 t (x*-X)~ /Cx2 ] 0, V(Y *) + P(X*- 0,) + (x*-;ST>~/CX~] t ( ~ * - 6 , ) ~ /u:] ( (n-2)/(n-3) ) [ l / n + ( (x-6x)2 + (u:/N)) (2s) S1 random, X* = 6, OY (a:/n> (3) S1 fixed, X* random 0, a: S1, X* random OY ( (n-2) (.",in) /(n-3) t ( v z / / (n-3) 'The n observations on U are always variable in "repeated" samples. 3 /zx2] ((n-2) / (n-3)) 6: [ l / n t (x*-%)~/CX~ - (6; IN) / z x 2 ] t t P 2 a2,/W (4) -a (.:In) ) + P2 o i / N (6: In) t ( (n-2) 1 (n-3) ) (?6 2 , / ~ /N The estimated value (U*) for a value of X = X'*is given by E(U" I S1 , X*) = 8, + p(X" - 8,) E(B IS, , X*) = E(B I X*) = 28,/3(X*- 6,) (27) From 21,27,29,30,32,and 15 V(Y*IS1,X*=8,) = a;/n + (X-O,)~ (a:/zx2) From 23,28,29,31,32,and 17 + V(Y*lS,) = o:/n ( o z / ~ + ( x - e , ) ~ )( ( a z / ~ x + ~ )p20;/N (35) From 24,27,29,31,32,and 18 V(Y* I X*) = (a; In) ((n-2)/(n-3)) + ( o;/(n-3)) ( ( ~ * - 6 , ) /o; ~ ) (36) From 25,28,29,31,32, and 19 From 26,28,29,31,32, and 20 If we define the unbiasedness of the variance estimators for cases (I), (1s) and (2s) is clear. for (x*-X), the expression for the estimated variance for Substituting (x*-0,)-(;if-6,) case (2) can be written +(Y* I x*) = EVV* I x*) 6; /n + 6; [ (x*- /zx2 + (iT-8x)2/~x2] ~ = o:/n + U; [ (x*+ E ( ( X - B , ) ~ / Z X)~] + 2(x*- 6,) (X- ex)/ z x 2 ( / z1x 2 ) - 2 ( ~ * 6,) - E ((X- e,)/zx2) =oE/n t o,2[(~*-6,)2/(o~(n-3)) - 0 = (o; /(n-3)) ((n-2)/n + l/(n(n-3) )] + (x*-o,)~ / 0:) For case (3) we have E ( ~ ~ ~ ; I N,x*) I S , = ( 6 : / ~ ) ( p ~+-t-;/zx2) E ( ~ ~ ~ ~ ; ~ =I N(o:/N)(p2 I S , ) +o;/zx2) E[(6;) ( I / n + ( X - X * ) ~ / ~ X ~ - ( ~ / NISl,X*] )/~X~) = a; ( l/n t (X-x*)~/Cx2 - (6; /N)/zx2 ) E [(X-X*')~1 S1] =E [ ((X-8,) =E [ ( (X- = + (X*-8,) ) 2 1 S,] + 2(X- 6,) (x*- 6,) + (x*- + 0 + o;/N ) I S, ] (40) Using 39,40, and 41, we have = /Ex2 + (0; IN) /Zx2 - (02 IN) / z x 2 ) + ( 1In + (X- o2U ~ / N For case (4) we have E(?~;/N I S l , X*) = E[(~;/N) (P2 = (;:IN) + u:/Ex2) P2 U$/N + (0: (P2 + u$/;1;x2) Is1]= (U;/N) (P2 + u;/;1;x2) /N)(l/ (Zx2/u;)) [11(~x210;)l= E(l/x2,., ) = ll(n-3) and E(@ h2 /IN) = p2 U$/N + (u:/N)/(n-3) which indicates that the variance estimator for case (4) is unbiased. NOTE l ~ o examples, r see Cochran, William 6. Sampling tedzniques. Ed. 2. New York: John Wiley and Sons, Inc. p. 189-205. 1963; and Cunia, T. Some theory on reliability o f volume estimates in a forest inventory sample. For. Sci. 11: 115-128. 1965. The Authors WILLIAM 6. O'REGAN is chief of the Station's biometrics branch, and also a lecturer in the School of Forestry and Conservation, University of California, Berkeley. He earned a B.S. degree (1949) and a doctorate (1962) in agricultural economics at the University of California, Berkeley. ROBERT W. BOYD was formerly a statistician in the Station's biometrics -3 branch. He is a 1972 graduate, in statistics, of the University of California, 8 Berkeley. The Forest Sewice of the U.S. Depwment of A g r i c d b e . . . Conducts forest and range research at more than 75 locations from Puerto E m to Alaska and Hawaii. . . . Participates with all State forestry agencies in cooperative programs to protect and improve the Nation's 395 million acres of State, local, and private forest lands. . . . Manages and protects the 187-million-acre National Forest System for sustained yield of its many products and services. The Pacific Southwest Forest and Ramage Expedment S t a ~ o n represents the research branch of the Forest Service in California and Hawaii.
