Quarterly Residential Housing Update 2014 | Quarter 2 Baldwin County, AL
advertisement
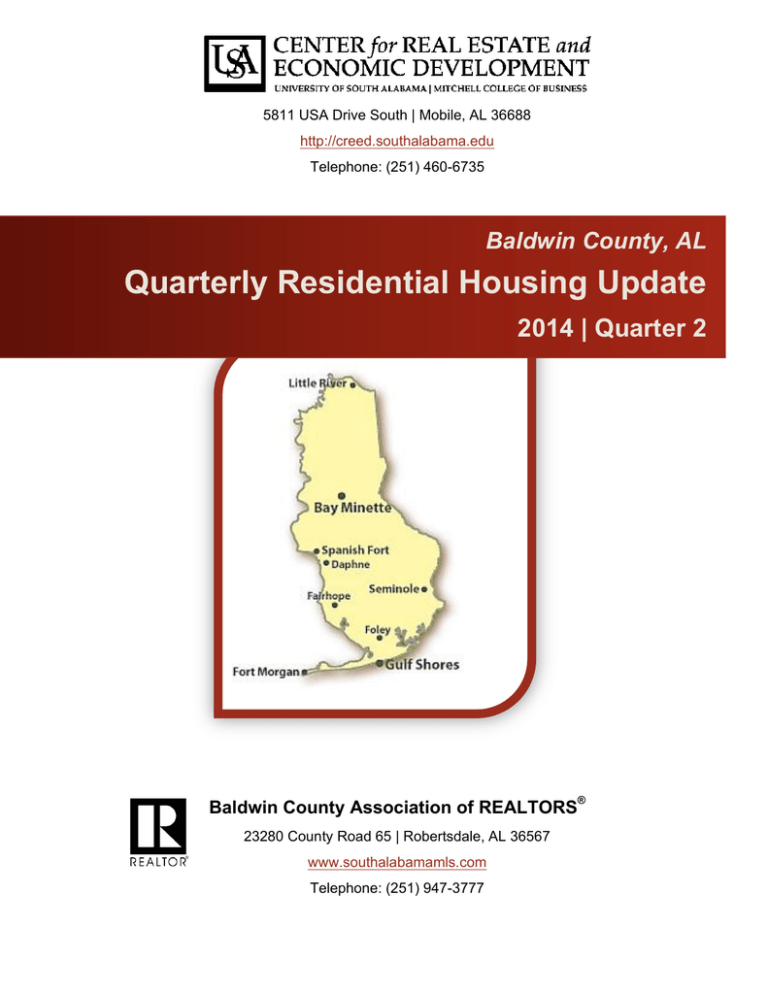
5811 USA Drive South | Mobile, AL 36688 http://creed.southalabama.edu Telephone: (251) 460-6735 Baldwin County, AL Quarterly Residential Housing Update 2014 | Quarter 2 Baldwin County Association of REALTORS® 23280 County Road 65 | Robertsdale, AL 36567 www.southalabamamls.com Telephone: (251) 947-3777 Baldwin Quarterly Residential Housing Update Table of Contents Baldwin County Sales Data ............................................. 2 Baldwin County Sales Data by Region ............................ 4 North Baldwin Region Sales Data by Zone...................... 5 Eastern Shore Region Sales Data by Zone ...................... 6 Central Baldwin Region Sales Data by Zone ................... 7 South Baldwin Region Sales Data by Zone...................... 8 Gulf Beach Region Sales Data by Zone ........................... 9 Credentials and Contact Information ........................... 10 2014 – Quarter 2 1 Baldwin Quarterly Residential Housing Update Baldwin County Sales Data Total unit sales for the second quarter of 2014 in Baldwin County were 1,363. Compared to the second quarter of 2013, total unit sales increased by 3.89% in the second quarter of 2014. Of the 1,363 sales, 67.79% were single family homes and 32.21% were condo/multifamily homes. Most residential properties sold in the $100,000-$199,999 price range, with most of them being single family properties. Total Unit Sales by Price Range 2014 - Q2 Price Range Single Family Condo/Multifamily $0-$99,999 $100,000-$199,999 $200,000-$299,999 $300,000-$499,999 $500,000-$999,999 Over $1 million Total % of Total Sales 129 387 224 129 48 7 45 134 73 111 54 22 174 521 297 240 102 29 924 67.79% 439 32.21% 1363 100% Total Unit Sales 1312 1400 1300 1200 Total Total Unit Sales by Property Type 1363 Single Family 1194 + 3.89% 1099 699 924 875 771 1100 Condo/Multifamily 400 423 437 439 2011 - Q2 2012 - Q2 2013 - Q2 2014 - Q2 1000 900 800 2011 - Q2 2012 - Q2 2013 - Q2 2014 - Q2 Average days on the market (DOM) for the second quarter of 2014 were 154 days. Compared to the second quarter of 2013, average DOM decreased by 15.38%. Avg. DOM 200 189 181 182 154 150 - 15.38% 100 50 0 2011 - Q2 2012 - Q2 2013 - Q2 2014 - Q2 2014 – Quarter 2 2 Baldwin Quarterly Residential Housing Update Baldwin County Sales Data (continued) Average sales price in Baldwin County increased to $258,524 in the second quarter of 2014, a 5.37% change from the second quarter of 2013. Median sales price was 4.20% higher in the same period. Median sales price has been on an increasing trend since the second quarter of 2011. Quarterly Average & Median Sales Price by Year Single Family, Condo/Multifamily $280,000 $260,000 $240,000 $220,000 $200,000 $180,000 $160,000 $140,000 $120,000 $100,000 Average Sale Price Median Sale Price + 5.37% + 4.20% 2011 - Q2 $217,057 $160,300 2012 - Q2 $247,750 $177,745 2014 - Q2 $258,524 $195,900 Total Quarterly Sold Dollar Volume by Property Type Total Sold Dollar Volume 2014 - Q2 Single Family 2013 - Q2 $245,341 $188,000 Condo/Multifamily $143,867,120 40.83% $208,500,854 59.17% + 11.49% $225,000,000 $200,000,000 $175,000,000 $150,000,000 $125,000,000 $100,000,000 $75,000,000 $50,000,000 + 8.12% 2011 - Q2 2012 - Q2 Single Family 2013 - Q2 2014 - Q2 Condo/Multifamily Total Sold Dollar Volume Single Family, Condo/Multifamily $400,000,000 $350,000,000 $300,000,000 $250,000,000 $200,000,000 $150,000,000 $100,000,000 $295,814,059 $321,887,976 $352,367,974 $238,545,329 + 9.47% 2011 - Q2 2012 - Q2 2013 - Q2 2014 - Q2 2014 – Quarter 2 3 Baldwin Quarterly Residential Housing Update Baldwin County Sales Data by Region Total Unit Sales Region North Baldwin Eastern Shore Central Baldwin South Baldwin Gulf Beach 2013 - Q2 2014 - Q2 31 447 89 260 485 32 448 76 314 493 Change 2014 - Q2 North Baldwin 2% 3.23% 0.22% -14.61% 20.77% 1.65% Eastern Shore Central Baldwin 36% 33% South Baldwin 23% Gulf Beach 6% Average Sales Price Region North Baldwin Eastern Shore Central Baldwin South Baldwin Gulf Beach 2013 - Q2 2014 - Q2 $130,049 $247,905 $134,660 $148,337 $322,661 $133,028 $252,240 $125,807 $165,691 $351,966 Change 2.29% 1.75% -6.57% 11.70% 9.08% 2013 - Q2 $400,000 $300,000 $200,000 $100,000 $0 North Baldwin Eastern Shore 2014 - Q2 Central Baldwin South Baldwin Gulf Beach South Baldwin Gulf Beach South Baldwin Gulf Beach Median Sales Price Region North Baldwin Eastern Shore Central Baldwin South Baldwin Gulf Beach 2013 - Q2 $117,500 $210,000 $125,000 $127,250 $272,000 2014 - Q2 $119,450 $215,538 $119,250 $145,000 $280,125 Change 1.66% 2.64% -4.60% 13.95% 2.99% 2013 - Q2 $500,000 $400,000 $300,000 $200,000 $100,000 $0 North Baldwin Eastern Shore 2014 - Q2 Central Baldwin Average Days on the Market Region North Baldwin Eastern Shore Central Baldwin South Baldwin Gulf Beach 2013 - Q2 164 167 127 166 216 2014 - Q2 168 158 170 159 145 Change 2.44% -5.39% 33.86% -4.22% -32.87% 2013 - Q2 300 2014 - Q2 200 100 0 North Baldwin Eastern Shore Central Baldwin Total Home Sales Sold Dollar Volume Region 2013 - Q2 2014 - Q2 North Baldwin Eastern Shore Central Baldwin South Baldwin Gulf Beach $4,031,515 $4,256,880 $110,813,512 $113,003,569 $11,984,765 $9,561,353 $38,567,554 $52,026,847 $156,490,630 $173,519,325 Change 5.59% 1.98% -20.22% 34.90% 10.88% 2014 - Q2 North Baldwin 1% Eastern Shore Central Baldwin 49% 32% South Baldwin 3% 15% Gulf Beach 2014 – Quarter 2 4 Baldwin Quarterly Residential Housing Update North Baldwin Region Sales Data by Zone Total Unit Sales Zone 2013 - Q2 Bay Minette Stapleton North Baldwin County 2014 - Q2 23 4 4 Change 26 4 2 2014 - Q2 13.04% 0.00% -50.00% Bay Minette 13% 6% Stapleton 81% North Baldwin County Average Sales Price Zone 2013 - Q2 Bay Minette Stapleton North Baldwin County 2014 - Q2 $113,022 $211,125 $146,878 $122,384 $190,350 $156,750 Change 8.28% -9.84% 6.72% 2013 - Q2 $300,000 2014 - Q2 $200,000 $100,000 $0 Bay Minette Stapleton North Baldwin County Median Sales Price Zone 2013 - Q2 Bay Minette Stapleton North Baldwin County $89,000 $195,000 $122,055 2014 - Q2 $118,000 $173,200 $156,750 Change 32.58% -11.18% 28.43% 2013 - Q2 $300,000 2014 - Q2 $200,000 $100,000 $0 Bay Minette Stapleton North Baldwin County Average Days on the Market Zone 2013 - Q2 Bay Minette Stapleton North Baldwin County 202 52 56 2014 - Q2 170 195 89 Change -15.84% 275.00% 58.93% 2013 - Q2 300 2014 - Q2 200 100 0 Bay Minette Stapleton North Baldwin County Total Home Sales Sold Dollar Volume Zone 2013 - Q2 Bay Minette Stapleton North Baldwin County $2,599,505 $844,500 $587,510 2014 - Q2 $3,181,980 $761,400 $313,500 Change 22.41% -9.84% -46.64% 2014 - Q2 Bay Minette 7% 18% Stapleton 75% North Baldwin County 2014 – Quarter 2 5 Baldwin Quarterly Residential Housing Update Eastern Shore Region Sales Data by Zone Total Unit Sales Zone Spanish Fort Daphne Fairhope 2013 - Q2 2014 - Q2 57 197 193 66 211 171 Change 2014 - Q2 Spanish Fort 15% 15.79% 7.11% -11.40% Daphne 38% 47% Fairhope Average Sales Price Zone Spanish Fort Daphne Fairhope 2013 - Q2 2014 - Q2 $266,188 $201,286 $290,090 $302,081 $207,017 $288,805 Change 13.48% 2.85% -0.44% 2013 - Q2 $400,000 2014 - Q2 $200,000 $0 Spanish Fort Daphne Fairhope Median Sales Price Zone Spanish Fort Daphne Fairhope 2013 - Q2 $259,000 $179,000 $250,000 2014 - Q2 $286,500 $191,000 $228,000 Change 10.62% 6.70% -8.80% 2013 - Q2 $400,000 2014 - Q2 $200,000 $0 Spanish Fort Daphne Fairhope Average Days on the Market Zone Spanish Fort Daphne Fairhope 2013 - Q2 140 154 188 2014 - Q2 136 130 199 Change -2.86% -15.58% 5.85% 2013 - Q2 300 2014 - Q2 200 100 0 Spanish Fort Total Home Sales Sold Dollar Volume Zone 2013 - Q2 2014 - Q2 Spanish Fort Daphne Fairhope $15,172,707 $39,653,392 $55,987,413 $19,937,343 $43,680,606 $49,385,620 Change 31.40% 10.16% -11.79% Daphne 2014 - Q2 Fairhope Spanish Fort 17% Daphne 44% 39% Fairhope 2014 – Quarter 2 6 Baldwin Quarterly Residential Housing Update Central Baldwin Region Sales Data by Zone Total Unit Sales Zone Seminole Loxley Silverhill Robertsdale Summerdale 2013 - Q2 2014 - Q2 4 38 12 24 11 Change 1 23 5 33 14 2014 - Q2 -75.00% -39.47% -58.33% 37.50% 27.27% Seminole 19% 1% Loxley Silverhill 30% Robertsdale 43% 7% Summerdale Average Sales Price Zone Seminole Loxley Silverhill Robertsdale Summerdale 2013 - Q2 2014 - Q2 $105,339 $140,555 $146,584 $109,206 $167,491 $263,900 $114,543 $166,780 $111,596 $153,313 Change 150.52% -18.51% 13.78% 2.19% -8.46% 2013 - Q2 $300,000 2014 - Q2 $200,000 $100,000 $0 Seminole Loxley Silverhill Robertsdale Summerdale Median Sales Price Zone Seminole Loxley Silverhill Robertsdale Summerdale 2013 - Q2 $117,278 $128,950 $146,750 $93,250 $120,000 2014 - Q2 $263,900 $109,000 $160,000 $114,000 $140,000 Change 125.02% -15.47% 9.03% 22.25% 16.67% 2013 - Q2 $300,000 2014 - Q2 $200,000 $100,000 $0 Seminole Loxley Silverhill Robertsdale Summerdale Average Days on the Market Zone Seminole Loxley Silverhill Robertsdale Summerdale 2013 - Q2 210 127 143 105 124 2014 - Q2 97 169 187 178 153 Change -53.81% 33.07% 30.77% 69.52% 23.39% 2013 - Q2 300 2014 - Q2 200 100 0 Seminole Loxley Silverhill Robertsdale Summerdale Total Home Sales Sold Dollar Volume Zone 2013 - Q2 Seminole Loxley Silverhill Robertsdale Summerdale $421,355 $5,341,072 $1,759,003 $2,620,935 $1,842,400 2014 - Q2 $263,900 $2,634,489 $833,900 $3,682,679 $2,146,385 Change -37.37% -50.67% -52.59% 40.51% 16.50% 2014 - Q2 Seminole 3% Loxley 22% 28% 38% Silverhill Robertsdale 9% Summerdale 2014 – Quarter 2 7 Baldwin Quarterly Residential Housing Update South Baldwin Region Sales Data by Zone Total Unit Sales Zone Bon Secour Gulf Shores - North ICW Magnolia Springs Foley Lillian Elberta Zone Bon Secour Gulf Shores - North ICW Magnolia Springs Foley Lillian Elberta Zone 2013 - Q2 2014 - Q2 4 71 7 115 44 19 Average Sales Price 2013 - Q2 2014 - Q2 $116,025 $185,441 $186,371 $138,757 $103,720 $163,779 Median Sales Price 2013 - Q2 2 100 5 154 34 19 $75,500 $177,118 $246,604 $152,713 $119,390 $281,789 2014 - Q2 Bon Secour $120,250 $75,500 Gulf Shores - North ICW $158,500 $146,000 Magnolia Springs $124,900 $150,000 Foley $125,175 $151,000 Lillian $93,000 $60,000 Elberta $101,900 $152,000 Average Days on the Market Zone 2013 - Q2 2014 - Q2 Bon Secour 90 280 Gulf Shores - North ICW 153 145 Magnolia Springs 210 186 Foley 154 169 Lillian 196 123 Elberta 219 191 Total Home Sales Sold Dollar Volume Zone 2013 - Q2 2014 - Q2 Bon Secour Gulf Shores - North ICW Magnolia Springs Foley Lillian Elberta $464,100 $13,166,335 $1,304,600 $15,957,019 $4,563,700 $3,111,800 $151,000 $17,711,842 $1,233,020 $23,517,735 $4,059,250 $5,354,000 Change 2014 - Q2 Bon Secour 6% 1% -50.00% 40.85% -28.57% 33.91% -22.73% 0.00% Magnolia Springs 32% $300,000 Change -67.46% 34.52% -5.49% 47.38% -11.05% 72.05% Elberta 2013 - Q2 2014 - Q2 2013 - Q2 2014 - Q2 2013 - Q2 2014 - Q2 $200,000 $100,000 $0 $200,000 $100,000 $0 Change 211.11% -5.23% -11.43% 9.74% -37.24% -12.79% Lillian 1% Change -37.21% -7.89% 20.10% 20.63% -35.48% 49.17% Foley 49% Change -34.93% -4.49% 32.32% 10.06% 15.11% 72.05% Gulf Shores - North ICW 11% 300 200 100 0 2014 - Q2 Bon Secour 10% 0% Gulf Shores - North ICW 8% Magnolia Springs 34% Foley 45% 3% Lillian Elberta 2014 – Quarter 2 8 Baldwin Quarterly Residential Housing Update Gulf Beach Region Sales Data by Zone Total Unit Sales Zone 2013 - Q2 Orange Beach Gulf Shores - South ICW Fort Morgan 2014 - Q2 277 178 30 279 186 29 Change 2014 - Q2 Orange Beach 6% 0.72% 4.49% -3.33% Gulf Shores - South ICW 38% 56% Fort Morgan Average Sales Price Zone 2013 - Q2 Orange Beach Gulf Shores - South ICW Fort Morgan $394,540 $233,803 $186,205 2014 - Q2 $420,820 $263,631 $257,762 Change 6.66% 12.76% 38.43% 2013 - Q2 $600,000 2014 - Q2 $400,000 $200,000 $0 Orange Beach Gulf Shores - South ICW Fort Morgan Median Sales Price Zone 2013 - Q2 Orange Beach Gulf Shores - South ICW Fort Morgan $323,900 $184,000 $152,000 2014 - Q2 $350,000 $218,500 $233,500 Change 8.06% 18.75% 53.62% 2013 - Q2 $400,000 2014 - Q2 $200,000 $0 Orange Beach Gulf Shores - South ICW Fort Morgan Average Days on the Market Zone 2013 - Q2 Orange Beach Gulf Shores - South ICW Fort Morgan 227 192 251 2014 - Q2 130 153 234 Change -42.73% -20.31% -6.77% 2013 - Q2 300 2014 - Q2 200 100 0 Orange Beach Gulf Shores - South ICW Fort Morgan Total Home Sales Sold Dollar Volume Zone 2013 - Q2 2014 - Q2 Orange Beach Gulf Shores - South ICW Fort Morgan $109,287,480 $117,408,800 $41,617,000 $49,035,418 $5,586,150 $7,475,107 Change 7.43% 17.83% 33.82% 2014 - Q2 Orange Beach 4% Gulf Shores - South ICW 28% 68% Fort Morgan 2014 – Quarter 2 9 Baldwin Quarterly Residential Housing Update Credentials and Contact Information Data Source: All data is provided by the Baldwin Association of REALTORS® Multiple Listing Service. For further information about the data, contact Martha Taylor at marthataylor@baldwinrealtors.org or (251) 947-3777. All inquiries regarding this report should be directed to: Don Epley, Director Center for Real Estate & Economic Development Email: depley@southalabama.edu Phone: (251) 460-6735 This report was prepared by: Michelle Pinochet, Senior Research Analyst Center for Real Estate & Economic Development Mitchell College of Business University of South Alabama Disclaimer: USA takes reasonable measures to ensure the quality of the data and other information produced. However, warranty, expressed or implied, nor assumes any legal liability or responsibility for the accuracy, correctness, or USA makes no completeness of any information, nor represents that its use would not infringe on privately owned rights. Reference to any specific commercial product, process, or service does not constitute an endorsement, recommendation, or favoring by USA. 2014 – Quarter 2 10
