advertisement
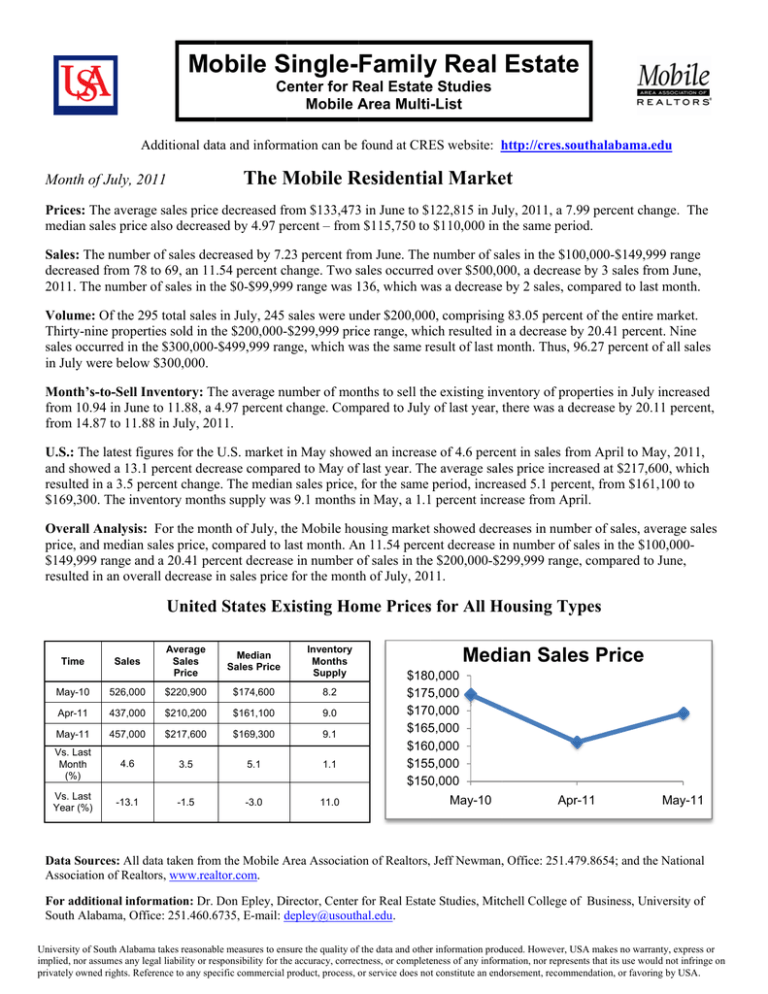
 Mo
obile SingleS
Family
y Real Estate
e
Center for Real
R
Estate
e Studies
Mobile Area
A
Multi-List
A
Additional
daata and inform
mation can be found at CRE
ES website: http://cres.so
h
outhalabamaa.edu
The Mobile
M
R
Residentia
al Markeet
Monnth of July, 2011
Pricees: The averaage sales pricee decreased frrom $133,4733 in June to $122,815 in Juuly, 2011, a 7..99 percent chhange. The
mediian sales pricee also decreassed by 4.97 peercent – from
m $115,750 to $110,000 in the same periiod.
Saless: The numbeer of sales deccreased by 7.223 percent froom June. The number of saales in the $1000,000-$149,999 range
decreeased from 788 to 69, an 11.54 percent chhange. Two sales
s
occurredd over $500,0000, a decreasse by 3 sales from
f
June,
2011. The numberr of sales in th
he $0-$99,9999 range was 136,
1
which was a decrease by 2 sales, coompared to laast month.
Volu
ume: Of the 295
2 total saless in July, 245 sales were unnder $200,0000, comprisingg 83.05 percennt of the entirre market.
Thirtty-nine properrties sold in th
he $200,000-$299,999 pricce range, whiich resulted inn a decrease by
b 20.41 percent. Nine
sales occurred in the
t $300,000--$499,999 rannge, which waas the same reesult of last month.
m
Thus, 96.27
9
percentt of all sales
in July were below
w $300,000.
Mon
nth’s-to-Sell Inventory:
I
The average nuumber of monnths to sell the existing invventory of prooperties in Jully increased
from
m 10.94 in June to 11.88, a 4.97
4 percent change.
c
Com
mpared to July of last year, there
t
was a decrease
d
by 200.11 percent,
from
m 14.87 to 11.888 in July, 20
011.
U.S.:: The latest figures for the U.S. market in May showed an increase of 4.6 perceent in sales from April to May,
M 2011,
and showed
s
a 13.11 percent decrrease comparred to May off last year. Thhe average sales price increeased at $217,,600, which
resullted in a 3.5 percent changee. The mediann sales price, for the same period, increased 5.1 percent, from $1661,100 to
$1699,300. The invventory month
hs supply wass 9.1 months in May, a 1.11 percent increease from Appril.
Overrall Analysis: For the mon
nth of July, thhe Mobile houusing market showed decrreases in numb
mber of sales, average
a
sales
pricee, and mediann sales price, compared
c
to last
l month. An 11.54 perceent decrease in number of sales
s
in the $100,000$1499,999 range annd a 20.41 perrcent decrease in number of
o sales in thee $200,000-$2299,999 rangee, compared to
t June,
resullted in an overrall decrease in sales pricee for the montth of July, 20111.
United
d States Exxisting Home Pricess for All Housing
H
Tyypes
Tim
me
Sales
Average
Sales
Price
Median
Sales Price
Inventory
Months
Supply
Mayy-10
526,000
0
$220,900
$174,600
8.2
Aprr-11
437,000
0
$210,200
$161,100
9.0
Mayy-11
457,000
0
$217,600
$169,300
9.1
Vs. Last
onth
Mo
(%
%)
4.6
3.5
5.1
1.1
Vs. Last
Yearr (%)
-13.1
-1.5
-3.0
11.0
Median Sale
es Price
$180
0,000
$175
5,000
$170
0,000
$165
5,000
$160
0,000
$155
5,000
$150
0,000
May-10
Apr-11
May-11
Data Sources: All data
d taken from
m the Mobile Area
A Associatioon of Realtors, Jeff Newman,, Office: 251.479.8654; and the
t National
Assocciation of Realltors, www.realtor.com.
For additional
a
infoormation: Dr. Don Epley, Diirector, Center for Real Estate Studies, Mitcchell College of
o Business, University
U
of
Southh Alabama, Off
ffice: 251.460.6
6735, E-mail: depley@usouth
d
hal.edu.
Universiity of South Alabam
ma takes reasonab
ble measures to enssure the quality off the data and otherr information prodduced. However, USA
U
makes no warrranty, express or
implied, nor assumes any legal
l
liability or reesponsibility for thhe accuracy, correcctness, or completeeness of any inform
mation, nor represents that its use woould not infringe oon
p
process, or
o service does not constitute an enddorsement, recomm
mendation, or favooring by USA.
privatelyy owned rights. Reeference to any speecific commercial product,
July 2011 Mobile County Single-Family Residential Report
Average Sales Price
$200,000
Median Sales Price
$160,000
$140,000
$150,000
$120,000
$100,000
$100,000
$80,000
$60,000
$50,000
$40,000
$20,000
$0
$0
Jul-08
Jul-09
Month
Ave. Sales $
Jul-08
$160,486
Jul-09
$143,690
Jul-10
$138,172
Jun-11
$133,473
Jul-11
$122,815
Annual 09
$143,092
Annual 10
$136,630
Jul-10
Jun-11
vs. Last Year
(%)
Jul-11
Jul-08
vs. Last
Month (%)
Month
Jul-10
Med. Sales $
Jun-11
vs. Last
Year (%)
Jul-08
$137,750
-10.47
Jul-09
$130,000
-5.63
-3.84
Jul-10
$117,000
-10.00
-7.99
-4.52
Jun-11
$115,750
Jul-11
$110,000
Annual 09
$127,100
$120,000
Annual 10
Number of Sales
500
Jul-09
vs. Last
Month (%)
-4.97
-5.59
Month's Inventory
20.00
400
Jul-11
15.00
300
10.00
200
5.00
100
0.00
0
Jul-08
Month
Jul-09
Jul-10
Jun-11
# Sales
vs. Last Year
(%)
Jul-08
Jul-11
vs. Last
Month (%)
Jul-09
Month
Jul-10
Month's
Inventory
Jun-11
vs. Last
Year (%)
Jul-08
402
Jul-08
8.80
Jul-09
355
-11.69
Jul-09
10.22
16.14
Jul-10
279
-21.41
Jul-10
14.87
45.50
Jun-11
318
Jun-11
10.94
Jul-11
295
Jul-11
11.88
Annual 09
3481
Annual 10
3321
-7.23
-4.60
Annual 09
12.32
Annual 10
14.19
Jul-11
vs. Last
Month (%)
8.59
15.18
0-$99,999
$100,000$149,999
$150,000$199,999
$200,000$299,999
$300,000$499,999
Jul-08
114
119
87
50
23
9
Jul-09
104
114
65
57
13
2
Jul-10
113
67
47
34
14
4
Jun-11
138
78
39
49
9
5
Jul-11
136
69
40
39
9
2
Ann. 09
1145
1092
616
451
143
34
Ann. 10
1283
912
536
419
129
42
Number
Month
Over $500K
Price Range of Sales
160
140
120
100
80
60
40
20
0
Jul-08
Jul-09
Jul-10
Jun-11
Jul-11