Research Report 13-3 Summary
advertisement
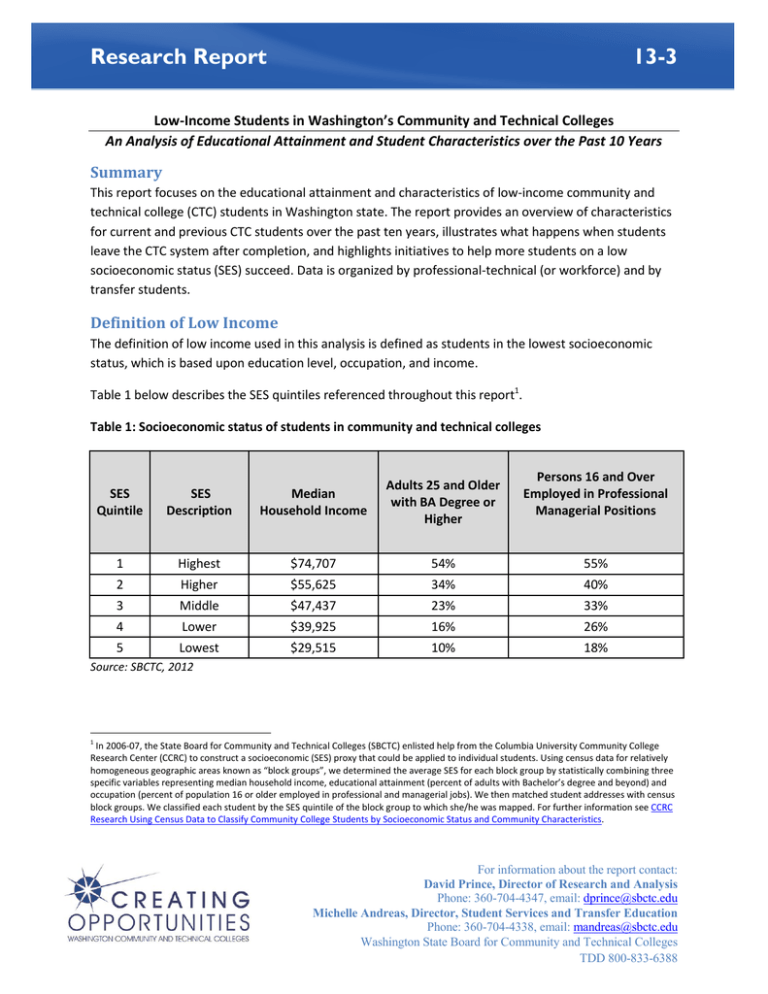
Research Report 13-3 Low-Income Students in Washington’s Community and Technical Colleges An Analysis of Educational Attainment and Student Characteristics over the Past 10 Years Summary This report focuses on the educational attainment and characteristics of low-income community and technical college (CTC) students in Washington state. The report provides an overview of characteristics for current and previous CTC students over the past ten years, illustrates what happens when students leave the CTC system after completion, and highlights initiatives to help more students on a low socioeconomic status (SES) succeed. Data is organized by professional-technical (or workforce) and by transfer students. Definition of Low Income The definition of low income used in this analysis is defined as students in the lowest socioeconomic status, which is based upon education level, occupation, and income. Table 1 below describes the SES quintiles referenced throughout this report1. Table 1: Socioeconomic status of students in community and technical colleges Persons 16 and Over Employed in Professional Managerial Positions SES Quintile SES Description Median Household Income Adults 25 and Older with BA Degree or Higher 1 Highest $74,707 54% 55% 2 Higher $55,625 34% 40% 3 Middle $47,437 23% 33% 4 Lower $39,925 16% 26% 5 Lowest $29,515 10% 18% Source: SBCTC, 2012 1 In 2006-07, the State Board for Community and Technical Colleges (SBCTC) enlisted help from the Columbia University Community College Research Center (CCRC) to construct a socioeconomic (SES) proxy that could be applied to individual students. Using census data for relatively homogeneous geographic areas known as “block groups”, we determined the average SES for each block group by statistically combining three specific variables representing median household income, educational attainment (percent of adults with Bachelor’s degree and beyond) and occupation (percent of population 16 or older employed in professional and managerial jobs). We then matched student addresses with census block groups. We classified each student by the SES quintile of the block group to which she/he was mapped. For further information see CCRC Research Using Census Data to Classify Community College Students by Socioeconomic Status and Community Characteristics. For information about the report contact: David Prince, Director of Research and Analysis Phone: 360-704-4347, email: dprince@sbctc.edu Michelle Andreas, Director, Student Services and Transfer Education Phone: 360-704-4338, email: mandreas@sbctc.edu Washington State Board for Community and Technical Colleges TDD 800-833-6388 Report Highlights: Workforce Students The percent of low Socioeconomic Status (SES) students receiving some level of workforce (professional-technical) training has decreased slightly over time. From 2001-2011, the percent of workforce students who received some level of workforce training was consistent among low and high SES students. However, a disparity emerged in 2010-2011, when 55 percent of low SES workforce students received workforce training compared to 60 percent of high SES workforce students (Table 3). High SES workforce students are more likely to earn long-term workforce certificates and degrees. High SES students are more likely to attain long-term certificates and degrees; low SES students are more likely to earn short-term workforce certificates. In most cases, the higher the level of attainment, the higher the employment and income. From 2001-2011, 28 percent of high SES students attained a degree or long-term certificate (at least one year) compared to 22 percent of low SES students. Those numbers have remained fairly consistent from year to year (Table 4). Report Highlights: Transfer Students More high SES transfer students enter a 4-year institution shortly after leaving college. High SES students are slightly more likely than low SES students to leave a community or technical college with a degree or at least one year of college preparation (Table 7). Within one year of leaving a community or technical college, high SES students are more likely than low SES students to transfer to a public or private four-year institution (Table 8). From 2001 to 2011, low SES students trailed high SES students by at least 10 percentage points. Report Highlights: Student characteristics Characteristics of low-income students are important factors in determining post-secondary education success. Low SES students are more likely to be older, single-parent, people of color who are first in their families to go to college (Tables 9, 10, 11, 12). Older students. Students 20 years and older, many who delay college, are more likely to be low SES than younger students attending community and technical college directly from high school. Students with children. Single parents in particular are likely to be low SES. Students of color. While race/ethnicity is not part of the socioeconomic status definition, low SES students are more likely to be students of color such as Hispanic, African American or Native American. First generation students (first in the family to go to college). Students in the lowest SES quintile have a lower percentage of their mother’s highest reported level of education as college than students in the highest quintile. Research Report 13-3 April 2013 2 Washington State Board for Community and Technical Colleges Other data on workforce and transfer students The State Board for Community and Technical Colleges (SBCTC) tracks both professional-technical and transfer students after they leave college. Two reports in particular describe the significant benefits for attending a community and technical college (CTC): The Workforce Board’s Net Impact Study. The 2012 Net Impact Study conducted by the Upjohn Institute on behalf of the Workforce Training and Education Coordinating Board (Workforce Board), shows that professional-technical education pays. The study shows a 10 percent positive net impact on participants in community and technical college training, compared to non-participants. In addition, CTC training participants are shown to earn approximately $8,500 more than non-participants annually. The Washington Student Achievement Council Transfer Study. The 2009 WSAC study shows that CTC transfer students comprise nearly 40 percent of bachelor degree graduates in public 4-year institutions. Transfer students contribute to BA graduates in all fields including 32 percent of STEM degrees to 50 percent of education degrees. Research Report 13-3 April 2013 3 Washington State Board for Community and Technical Colleges Part 1: Attainment Rates for Professional-Technical and Transfer Students Professional-technical program students in the past 10 years As shown in Table 2 below, nearly 41,000 students left college from professional-technical programs in 2010-11. Enrollments (and students exiting college) grew annually from 2007 to 2011. Table 2: Overview of students leaving CTC professional-technical programs (2001 – 2011) Students Leaving Professional-Technical Programs 2001-02 40,880 38,394 36,845 33,913 33,240 2006-07 2007-08 35,184 2008-09 2009-10 2010-11 Source: SBCTC, 2012 Note: 2003-04 data not shown due to a glitch, rendering it highly unreliable. Table 3 below shows that until 2010-11, attainment rates were similar across all SES quintiles of students leaving professional-technical programs. Attainment levels are the percentage of students who left college with at least some postsecondary education in a professional-technical field, preparing them for work. The Workforce Board’s Net Impact Study shows positive gains in employment and earnings for students participating in professional-technical training at a community or technical college. In 2010-11, 60 percent of students in the middle to high SES increased their post-secondary attainment compared to 55 percent of students in the lowest SES quintile. Table 3: Workforce students increasing post-secondary attainment (high to low SES) Percent of Workforce Students Leaving College Who Increased Post-Secondary Attainment High to Low SES Students Year High 2 3 4 Low 2001-02 55% 57% 58% 59% 57% 2006-07 59% 60% 60% 60% 59% 2007-08 54% 56% 57% 58% 57% 2008-09 53% 56% 57% 55% 53% 2009-10 56% 56% 58% 57% 55% 2010-11 60% 60% 60% 58% 55% Source: SBCTC, 2012 Research Report 13-3 April 2013 4 Washington State Board for Community and Technical Colleges Attainment reached by professional-technical students Table 4 below shows low SES students in professional-technical programs leave college with lower levels of postsecondary attainment compared to high SES students. For example, in 2010-11, 22 percent of low SES students left college with a degree or long certificate (at least one year), compared to 28 percent of high SES students. These disparities remain constant over the past ten years. Low SES students are more likely to exit with some college, but less than one year. While this does increase student earnings and employment overall, students who reach higher levels of post-secondary attainment have higher earnings and employment in most cases. The left column in Table 4 illustrates students who have a degree or long certificate. The right column illustrates students who have some or less than a year of college. Table 4: Professional-technical attainment levels for degrees, long certificates compared with some or less than one year of college (high to low SES) 2001-02 2006-07 2007-08 2008-09 2009-10 2010-11 Highest Attainment- Degree or Long Certificate High 2 3 4 Low 28% 28% 27% 26% 22% 28% 27% 27% 26% 22% 26% 26% 27% 26% 23% 25% 25% 25% 23% 20% 24% 25% 26% 26% 23% 28% 28% 27% 25% 22% 2001-02 2006-07 2007-08 2008-09 2009-10 2010-11 Highest Attainment- Some College, Less than 1 Year High 2 3 4 Low 9% 13% 13% 16% 20% 14% 16% 18% 20% 23% 12% 14% 14% 18% 19% 16% 18% 19% 20% 24% 18% 18% 18% 18% 19% 20% 24% 23% 24% 26% Source: SBCTC, 2012 Transfer students in the past ten years Table 5 below illustrates the number of students leaving academic transfer programs. Attainment rates for transfer students is the total percent of students who earned an associate degree or who completed at least one year of college transfer preparation. In 2010-11, nearly 62,000 students left college from an academic transfer program. The number stayed fairly steady throughout the past ten years, rising at the end as college enrollments increased dramatically. Table 5: Overview of students leaving CTC academic transfer programs (2001 – 2011) Students Leaving Academic Transfer Programs 58,203 58,288 57,331 58,505 59,279 61,998 2001-02 2006-07 2007-08 2008-09 2009-10 2010-11 Source: SBCTC, 2012 Note: 2003-04 data not shown due to a glitch, rendering it highly unreliable. Research Report 13-3 April 2013 5 Washington State Board for Community and Technical Colleges Table 6 below shows attainment rates over the past ten years for high to low SES students. As illustrated, attainment rates improved for all students, but a gap persists between the lowest SES and other transfer students. Table 6: Transfer students increasing post-secondary attainment (high to low SES) Percent of Transfer Students Leaving College Increasing Post-Secondary Attainment (High to Low SES) Year 2001-02 2006-07 2007-08 2008-09 2009-10 2010-11 High SES 40% 41% 43% 44% 45% 47% 2 42% 42% 43% 43% 43% 48% 3 43% 43% 44% 43% 44% 47% 4 42% 44% 44% 42% 44% 47% Low SES 38% 39% 39% 37% 39% 42% Source: SBCTC, 2012 Highest attainment reached by transfer students Table 7 below shows the attainment levels reached by transfer students, from high to low SES. In general, the percentage of students leaving with some college, but no degree, has increased for all SES quintiles and is higher than degree attainment. The left column in Table 7 illustrates students who have a degree. The right column illustrates students who have some or less than a year of college. Students without a transfer degree are less likely to attend a four-year college or university. Table 7: Transfer attainment levels for degrees compared to at least one year of college (high to low SES) 2001-02 2006-07 2007-08 2008-09 2009-10 2010-11 High 20% 18% 19% 20% 21% 22% Highest Attainment- Degree 2 3 4 21% 20% 20% 18% 20% 21% 19% 21% 21% 20% 21% 20% 20% 21% 21% 23% 23% 23% Low 17% 18% 18% 17% 17% 19% 2001-02 2006-07 2007-08 2008-09 2009-10 2010-11 Highest Attainment- At least one year of college, High 2 3 4 Low 20% 21% 22% 22% 20% 23% 24% 23% 23% 21% 24% 24% 24% 23% 21% 23% 23% 22% 22% 20% 23% 23% 22% 22% 20% 25% 25% 25% 24% 23% Source: SBCTC, 2012 Research Report 13-3 April 2013 6 Washington State Board for Community and Technical Colleges Where they go: transfer students within one year Table 8 below shows what happens to transfer students after they leave a community or technical college. As illustrated, there is a disparity between high and low SES students. The percent of CTC transfer students enrolling in a 4-year institution (public and private) was at least 10 percent lower for the lowest SES students. This trend continues with fewer students from the lowest SES transferring to baccalaureate degree programs. Table 8: Students transferring to a 4-year institution (within one year) Percent of Students Transferring to a 4-Year Institution within One-Year (with or without degree) Year 2001-02 2006-07 2007-08 2008-09 2009-10 2010-11 High SES 22% 34% 35% 33% 32% 31% 2 19% 30% 32% 30% 27% 27% 3 17% 27% 28% 26% 24% 25% 4 16% 25% 26% 26% 23% 24% Low SES 12% 20% 21% 20% 19% 19% Source: SBCTC, 2012 Part 2: Comparisons of Student Characteristics for the Past Ten Years As mentioned in the highlights section of this report, student characteristics are important factors when observing student success in postsecondary education. Family status, age, and race/ethnicity coupled with SES status, show lower income students have a unique postsecondary education experience. Family status As detailed in Table 9 below, low SES students are more likely to be parents, and significantly more likely to be single parents. This trend has remained consistent over the past ten years. Table 9: Family status of students from 2001 and 2011 (high to low SES) 2010-11 Students Couple with Children or Other Dependents Single Parent with Children or Other Dependents Without Children or Other Dependents High 18% 2 17% 3 18% 4 19% Low 22% 6% 8% 11% 13% 17% 53% 52% 49% 46% 40% 2001-02 Students Couple with Children or Other Dependents Single Parent with Children or Other Dependents Without Children or Other Dependents High 19% 2 19% 3 20% 4 22% Low 24% 6% 8% 11% 13% 17% 54% 51% 48% 45% 39% Source: SBCTC, 2012 Research Report 13-3 April 2013 7 Washington State Board for Community and Technical Colleges Age Table 10 below shows low SES students are likely to be older. This pattern has changed over the past ten years with the student population becoming younger, especially for the highest SES quintile. For example, 32 percent are age 40 or above in 2001-02; compared to 19 percent age 40 and above in 2010-11. Table 10: Age of students from 2001 and 2011 (high to low SES) 2010-11 Students Under 20 Age 20-29 Age 30-39 Age 40 or Above High 24% 39% 18% 19% 2 24% 40% 17% 19% 3 23% 40% 18% 19% 4 21% 41% 19% 19% Low 17% 44% 21% 18% 2001-02 Students Under 20 Age 20-29 Age 30-39 Age 40 or Above High 20% 30% 19% 32% 2 22% 31% 18% 29% 3 21% 33% 18% 27% 4 20% 34% 19% 27% Low 18% 38% 21% 23% Source: SBCTC, 2012 Students of Color While the composition of students in community and technical colleges has become more diverse over the past ten years, Table 11 below shows low SES students remain more likely to be students of color. The disparity exists most dramatically with Hispanic students. For example, 7 percent of students are in the highest SES versus 23 percent of students in the lowest SES quintile. Table 11: Students of color from 2001 and 2011 (high to low SES) 2010-11 Students African American Asian/Pacific Islander (including Hawaiian) Hispanic Native American (American Indian or Alaskan Native) Other, Multiracial White High 4% 12% 7% 2 5% 12% 9% 3 8% 11% 12% 4 7% 9% 14% Low 11% 8% 23% 1% 1% 1% 2% 2% 5% 71% 6% 66% 6% 63% 5% 63% 6% 51% 2001-02 Students African American Asian/Pacific Islander (including Hawaiian) Hispanic Native American (American Indian or Alaskan Native) Other, Multiracial White High 3% 10% 5% 2 4% 10% 6% 3 5% 10% 8% 4 5% 8% 10% Low 8% 7% 20% 1% 1% 2% 2% 3% 2% 78% 2% 76% 2% 73% 2% 72% 2% 60% Source: SBCTC, 2012 Research Report 13-3 April 2013 8 Washington State Board for Community and Technical Colleges First generation Table 12 below shows low SES students are more likely to be first generation, based on a sample of Pell recipients enrolled in professional-technical and academic transfer programs. This has remained consistent over the past ten years. Table 12: First generation students from 2001 and 2011 (high to low SES) 2010-11 Students’ Mothers Highest Grade Level Completed Less than 8th Grade 8th Grade-12th Grade College 2001-02 Students’ Mothers Highest Grade Level Completed Less than 8th Grade 8th Grade-12th Grade College High 2 3 4 Low 8% 47% 45% 11% 50% 40% 12% 51% 37% 13% 51% 36% 18% 50% 33% High 2 3 4 Low 10% 48% 42% 11% 49% 40% 13% 51% 36% 14% 51% 35% 17% 50% 33% Source: SBCTC, 2012 Purpose of attending college High and low SES students attend college for different reasons. As detailed in Table 13, low SES students are more likely to attend college for workforce programs. A significant portion of low SES students attend for basic skills. Table 13: Why students attend college from 2001 and 2011 (high to low SES) 2010-11 Students Basic Skills Transfer Workforce High 8% 43% 49% 2 10% 41% 49% 3 13% 37% 50% 4 15% 33% 52% Low 24% 27% 49% 2001-02 Students Basic Skills Transfer Workforce High 7% 45% 48% 2 9% 40% 51% 3 12% 35% 53% 4 14% 32% 54% Low 24% 25% 51% Source: SBCTC, 2012 Research Report 13-3 April 2013 9 Washington State Board for Community and Technical Colleges Part 3: How Community and Technical Colleges are Responding Washington’s community and technical colleges are committed to helping all students succeed in college. With an open-door policy, CTCs provide instruction on a variety of levels. CTCs are already implementing initiatives to help adults at all income levels become college-ready, complete courses quicker, and obtain living wage jobs. Core to College Washington is one of ten states funded by a consortium of foundations through Rockefeller Philanthropies. SBCTC, Council of Presidents, Student Achievement Council and Office of the Superintendent of Public Instruction participate on a joint steering committee to communicate and share information regularly. Smarter Balanced 11th grade test based on Common Core State Standards and will be used by higher education as a college readiness test; scores will be mapped to specific college level courses. High school/college/university pilot projects are currently building senior year curriculum options in math. There is a statewide summit scheduled for this fall. Governance Institute for Student Success Focused on student success metrics and change strategies. Series of two day workshops for all trustees and presidents in 2011 and 2012. Achieving the Dream Focused on first year success for low income, precollege students. Washington has highest share of colleges in Achieving the Dream in the nation; six colleges are in phase one, ten colleges are in phase two, and two colleges are in phase three. Regional “Culture of Evidence” workshops are available for all colleges. I-BEST 170 programs, mostly adult basic and workforce education focused. 37 pilots focused on pre-college, academic, on-ramp, and corrections courses. An online web tool is used for I-BEST programs by program, college, and quarter. There is a statewide developmental education Acceleration Model to help students get through precollege courses simultaneously with workforce courses. Placement tests Colleges use multiple measures including standardized placement tests, high school transcripts, college transcripts, and initial class performance to determine precollege placement for students. A statewide reciprocity policy adopted in 2011, means that all colleges have implemented multiple assessment measures. Student Achievement Initiative Performance funding system throughout the entire statewide CTC system. Recently revised metrics provide greater emphasis on acceleration, achievement points for completing remedial sequence instead of remedial courses, and for completing gatekeeper freshman math and English courses. Research Report 13-3 April 2013 10 Washington State Board for Community and Technical Colleges Math pathways Two Washington state colleges are pilots in a national Statway project with the University of Texas and Carnegie Foundation. A Policy change has occurred with public universities to accept statistics as a college-level math course and intermediate algebra has been eliminated in the Direct Transfer Agreement. Developmental Math acceleration Funded by the Bill & Melinda Gates Foundation, math is department-wide at seven colleges. Programs implemented changed curricula and improved teaching approaches to increase student success across the system. Research Report 13-3 April 2013 11 Washington State Board for Community and Technical Colleges

