Document 11009231
advertisement
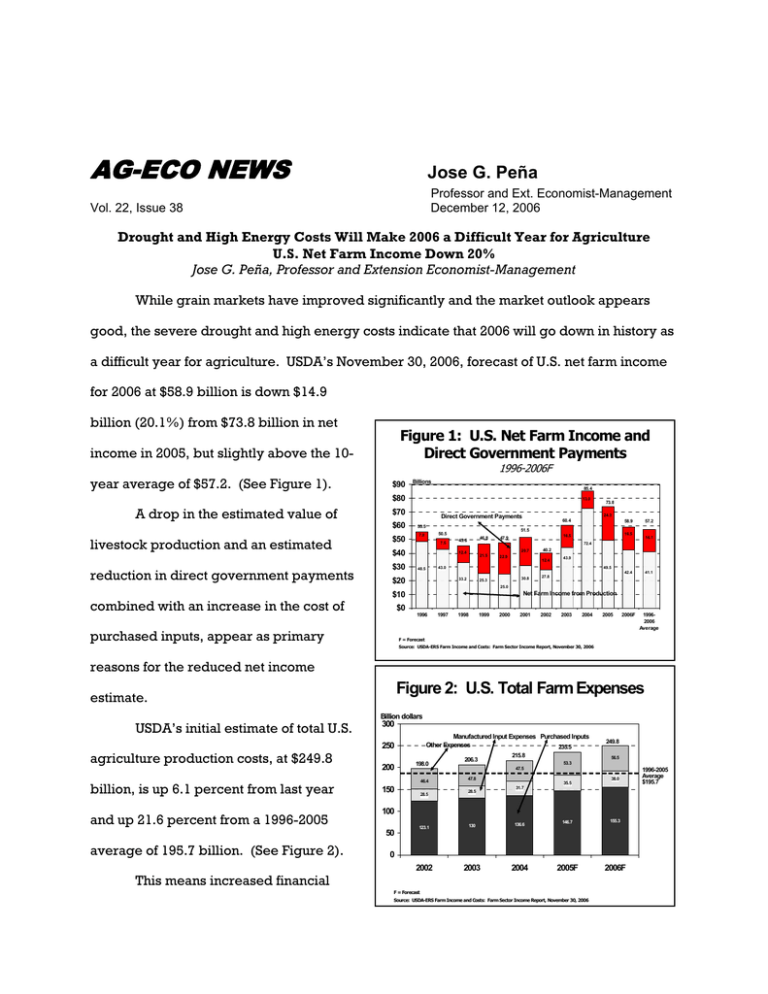
AG-ECO NEWS Jose G. Peña Vol. 22, Issue 38 Professor and Ext. Economist-Management December 12, 2006 Drought and High Energy Costs Will Make 2006 a Difficult Year for Agriculture U.S. Net Farm Income Down 20% Jose G. Peña, Professor and Extension Economist-Management While grain markets have improved significantly and the market outlook appears good, the severe drought and high energy costs indicate that 2006 will go down in history as a difficult year for agriculture. USDA’s November 30, 2006, forecast of U.S. net farm income for 2006 at $58.9 billion is down $14.9 billion (20.1%) from $73.8 billion in net Figure 1: U.S. Net Farm Income and Direct Government Payments income in 2005, but slightly above the 10year average of $57.2. (See Figure 1). 1996-2006F $90 Billions 85.4 $80 A drop in the estimated value of 13.0 $70 $60 livestock production and an estimated $50 reduction in direct government payments $30 55.5 7.5 $40 60.4 58.9 51.5 50.5 7.0 46.8 45.6 16.1 72.4 21.5 22.9 40.2 12.4 43.9 43.0 $20 57.2 16.5 16.5 47.9 20.7 12.4 48.5 73.8 24.3 Direct Government Payments 49.5 33.2 30.8 25.3 42.4 41.1 2006F 19962006 Average 27.8 25.0 combined with an increase in the cost of Net Farm Income from Production $10 $0 1996 purchased inputs, appear as primary 1997 1998 1999 2000 2001 2002 2003 2004 2005 F = Forecast Source: USDA-ERS Farm Income and Costs: Farm Sector Income Report, November 30, 2006 reasons for the reduced net income Figure 2: U.S. Total Farm Expenses estimate. USDA’s initial estimate of total U.S. agriculture production costs, at $249.8 billion, is up 6.1 percent from last year and up 21.6 percent from a 1996-2005 Billion dollars 300 200 This means increased financial 198.0 46.4 150 28.5 206.3 215.8 249.8 56.5 53.3 47.5 38.0 47.8 28.5 35.5 31.7 100 50 average of 195.7 billion. (See Figure 2). Manufactured Input Expenses Purchased Inputs Other Expenses 235.5 250 136.6 155.3 130 146.7 123.1 2002 2003 2004 2005F 2006F 0 F = Forecast Source: USDA-ERS Farm Income and Costs: Farm Sector Income Report, November 30, 2006 1996-2005 Average $195.7 risk, and while market prices are up, the estimate of farm program payments is down, meaning more risk. The estimate of total direct government payments for 2006 at $16.5 billion is down 32.2 percent from an estimate of $24.4 billion received in 2005. Both farmers and ranchers experienced major crop failures this year as a result of the severe drought. Crop agriculture experienced increased irrigation requirements at a critical time of record high energy costs. The index of Figure 3: Prices Paid Index for Fuels, 1996-2006 prices paid for fuels is now twice the value of what it was just four years ago, in 2002. (See Figure 3). Dr. Carl Anderson, Professor Emeritus, recently estimated crop losses in Texas during 2006 at about $4.1 billion ($2.5 billion crop; $1.6 billion livestock) due to the drought. Going into 2007 will require special financial planning. Early estimates indicate that while energy cost dropped this past fall, costs will continue to increase this winter and into 2007. Also, most of Texas is going into the 2007 crop year with a completely dry soil profile. While a large part of Texas received some rain this fall, the drought continues in a large part of Texas. The southwest Texas region, which probably closely mirrors the moisture situation in a large part of state, only received about 9.7 inches of scattered rainfall in 455 days, from September 1, 2005 through November 30, 2006, compared to a long term average of over 31 inches for the same period. The last 20 month period, from April 1, 2005 through November 30, 2006, was the driest period on record in Uvalde, Texas with only 16.8 inches of scattered rain compared with over 24 inches in 1934, the 2nd driest same period. (See Figure 4). Figure 4: Current Rainfall as Percent Long Term Average Rainfall by Month and Current Cumulative Rainfall as Percent of Long Term Cumulative Rainfall, Uvalde, Jan. ‘05-Nov. ‘06 150% 100% 50% 0% -50% Ja n05 Fe b0 M 5 ar -0 5 Ap r05 M ay -0 5 Ju n05 Ju l-0 Au 5 g0 Se 5 p05 O ct -0 No 5 v0 De 5 c05 Ja n0 Fe 6 b0 M 6 ar -0 6 Ap r06 M ay -0 Ju 6 n06 Ju l-0 Au 6 g0 Se 6 p06 O ct -0 No 6 v06 -100% Rainfall as % of long term Cumm. as % of long term Agricultural producers should prepare in-depth financial plans which cover short and long term goals and objectives and take into account the effects of a potential continuing drought and high energy costs over the next few years.
