Data Analysis for Decision Makers: A Reference for Local Officials
advertisement

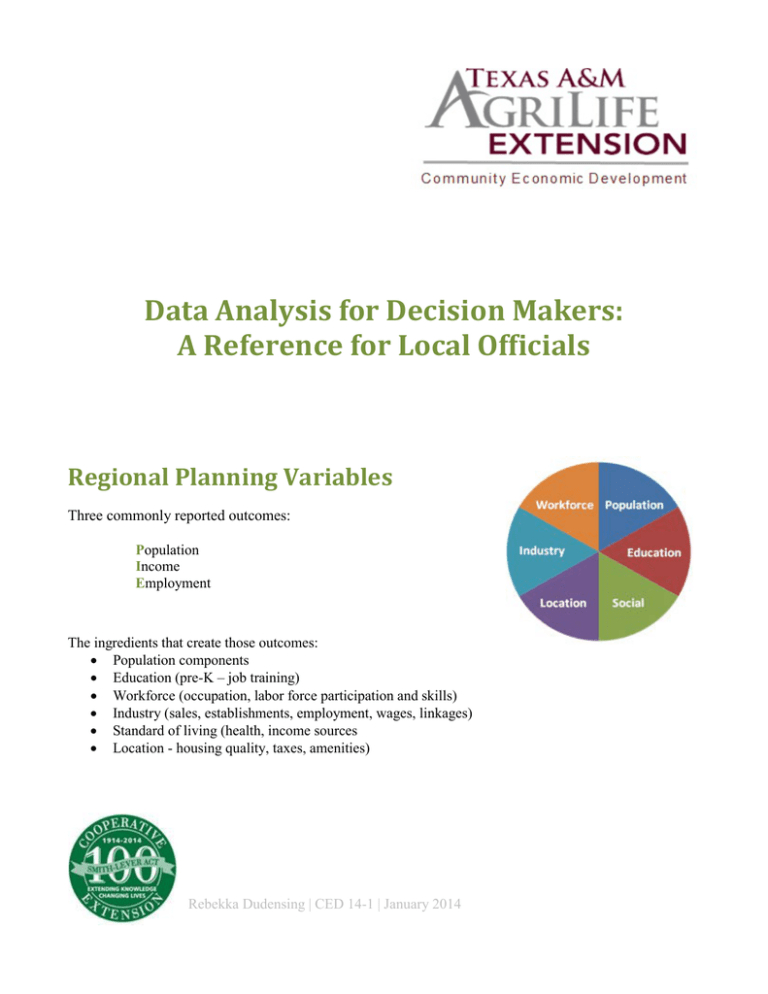
Data Analysis for Decision Makers: A Reference for Local Officials Regional Planning Variables Three commonly reported outcomes: Population Income Employment The ingredients that create those outcomes: • Population components • Education (pre-K – job training) • Workforce (occupation, labor force participation and skills) • Industry (sales, establishments, employment, wages, linkages) • Standard of living (health, income sources • Location - housing quality, taxes, amenities) Rebekka Dudensing | CED 14-1 | January 2014 Examples of data series within six themes are provided below. Each theme affects other themes, creating a wheel of economic development. Some variables are easier to influence than others, but it takes time (sometimes a generation or more) to see change in many variables. Economic development is long-term, ongoing process. Population • Size & Composition • Distribution • Migration Patterns • Changes Education • Performance Assessments • School Enrollment • Dropout Status Social Characteristics • Crime Rates • Poverty Status • Health Care Resources • Health & Nutrition Status • Food Assistance Enrollment • Child Care Access/Enrollment Location • Climate • Local taxes • Infrastructure • Cost of Living • Commuting Patterns • Natural Resource Amenities • Available Land & Buildings Industry • Firm Size • Age • Industry Sectors • Inter-industry Linkages Workforce • Educational Attainment • Occupation/Skills • Industry Participation Describing Data Community and business leaders use data to guide decision-making processes. Data are defined as “a body of facts, information.” Decision-makers use those facts to assess situations and alternatives objectively. The Merriam-Webster thesaurus suggests data as a synonym for knowledge, but data is information only if we can interpret and apply those facts. Qualitative data • deals with attributes • allows for open-ended responses that may not be countable • can help explain numerical responses. • Example: a focus group indicates that a region has a diverse population. Quantitative data • addresses the measurement of attributes, things that can be always be counted. • Example: a survey (or Census data) counts people by age, race or ethnicity. Either qualitative or quantitative data can be primary or secondary. Primary data • Collected by you • Time &/or $$$ • Asks exactly what you need to know Secondary data • Collected by someone else (e.g., Census Bureau, Comptroller) • Already exists so may be able to start analysis faster • Less expensive or free • May not provide everything you want at the time you want, esp. in rural areas • Users should consider reliability of the data source • may require caution in interpretation due to differences between collection times or geographies • Most useful for quantitative data Questions to Consider: • What is the source of the data? • Does it cover the correct geographical location? • Does it provide data on my target audience? • Does it deal with my issue/topic of concern? • Is it current data? • • Are the data available for the same time period? Are definitions of variables the same over time? Approaches to Analyzing Data: Cross-sectional: Look at data at one point in time Comparative: Examine the data in your county or region relative to other counties or regions, both regions similar to yours and those your region aspires to resemble Longitudinal: Focus on how the data change over a longer time period Examining trends can • Help identify a region’s competitive advantage • Highlight important changes in residents and business/industry • Understand what has and hasn’t worked in the past What to look for in your data: • Conditions – What appears to be happening? Is unemployment high or low? • Direction of change – How is the current condition changing over time? Is the employment picture improving or worsening over time? (Identify the time period(s)). • Intensity of change – How dramatic is the shift? • Overall picture – How does this piece of information fit with other information? Is unemployment lower because people are getting jobs, families are moving away, or the population is aging? Data Resources: Data sources that may be partciularly helpful to you are listed below. Census Bureau American FactFinder2 http://factfinder2.census.gov/main.html Data sets: Decennial Census, 2000, 2010 American Community Surveys Demographic, social, housing, and economic data available down to the Census block for the decennial census and at varying levels depending on data product for American Community Surveys (ACS). The census data includes basic gender, age, race, Hispanic ethnicity, and home-ownership variables. The ACS provides more detailed information about the population, including household and familial relationships, ancestry, language spoken, educational enrollment and attainment, income levels and sources, housing characteristics, occupation and industry of workers, and other variables. One-, three- and five-year ACS estimates are available for areas will a population larger than 65,000; areas with populations larger than 20,000 have three- and five-year averages; and less populated regions have five-year averages. The fiveyear averages are the most reliable. County Business Patterns http://www.census.gov/econ/cbp/ Employer establishments, employees, and first quarter and annual payrolls, and establishments by employment-size class by industry for each region (ZIP, county, metropolitan and micropolitan statistical area, State, US). Data are available at the six-digit NAICS level except to avoid disclosure of information about individual companies. Non-Employer Statistics http://www.census.gov/econ/nonemployer/ Similar to County Business patterns with data on non-employer firms (most self-employed individuals), including the number of establishments and total receipts. Data are available at the five-digit NAICS level except to avoid disclosure of information about individual companies. Statistics of US Businesses http://www.census.gov/econ/susb/ Total number of firms, number of establishments, employment, and annual payroll by employment-size for counties. That data is available by two-digit NAICS code for MSAs. Data are downloaded as an Excel file. Texas State Demographer Texas Demographic Data http://txsdc.utsa.edu/ Distributor of census and other federal data, including population estimates and projections, in Texas. Bureau of Economic Analysis Regional Economic Accounts http://www.bea.gov/regional/ Data sets: Local Area Personal Income and Employment 1969-2009 Regional Fact Sheets (BEARFACTS) County, MSA, combined metropolitan areas, BEA economic areas, state and US data related to income sources (including transfers and other non-earned income, full and part-time employment and earnings by industry, average wages, and farm income and expenses. Table CA-30 provides a numeric economic profile, but BEARFACTS also provides a narrative to accompany profile numbers. Bureau of Labor Statistics Various Databases and Tools http://www.bls.gov/data/ Data on unemployment, employment and employment projections by industry, payroll, price levels, workplace injuries, and productivity. The site also includes inflation and location quotient calculators. The data from the Southwest Regional office in Dallas may be of special interest to Texans (http://www.bls.gov/ro6/news.htm). Department of Agriculture Census of Agriculture (latest is 2007) http://www.agcensus.usda.gov/ State and county profiles include information about farms (e.g., number and size), farmers and crops produced at the county, state, and US levels. Comparisons between 2002 and 2007 point to trends in local agriculture. ZIP code tabulations available from the Quick Stats link. Quick Stats also provides annual crop information by county. Texas Education Agency Academic Excellence Indicator System http://www.tea.state.tx.us/perfreport/ Academic Excellence Indicator System reports by campus, district and region. Data include TAKS scores class size, and teacher experience, as well as students by grade, race; and economic, linguistic, discipline, and mobility status. Office of the Texas Comptroller of Public Accounts State and Local Taxes and Expenditures (and other topics) http://www.window.state.tx.us/ A trove of information on state and local government finances and taxes. Information about tax rates, levies and gross taxable sales is available from the Texas Taxes link. Department of State Health Services Texas Health Data http://soupfin.tdh.state.tx.us/ County and state birth and death-by-cause data, as well as other information on related pages. STATSAmerica http://statsamerica.org/profiles/us_profile_frame.html http://statsamerica.org/innovation/anydata/index.asp US Department of Labor/Employment and Training Administration O*Net http://www.onetcenter.org/ Information about occupations and their skill requirements. ______________________ Adapted from Stronger Economies Together and other materials: • SET Phase IV, Module2: Exploring the Region’s Economic & Demographic Foundations. Lionel J. Beaulieu. • SET Phase II, Module 5: Examining Current Demographic Features of Your Region, Alison F. Davis, University of Kentucky, http://srdc.msstate.edu/set/curriculum2/module5/module_5-instructors_guide.pdf. • Developing Critical Thinking Leaders Module 4: Strategies for Obtaining and Using Qualitative and Quantitative Data, Greg Clary, Texas A&M AgriLife Extension Service. • Dudensing, Rebekka. 2012. Data-Driven Decision-Making: A Data Primer. Texas A&M AgriLife Extension Service, Department of Agricultural Economics. CED 12-07, December. • Dudensing, Rebekka. 2011. Basic Data Sources for Community Leaders and Economic Development Professionals. Texas AgriLife Extension Service, Department of Agricultural Economics. August.


