c Journal of Applied Mathematics & Decision Sciences, 1(1), 67{71... Reprints Available directly from the Editor. Printed in New Zealand.
advertisement
c Journal of Applied Mathematics & Decision Sciences, 1(1), 67{71 (1997)
Reprints Available directly from the Editor. Printed in New Zealand.
Classroom Note
Radioactivity Half-Lives Considered as Data
phutchin@bunyip.bhs.mq.edu.au
School of Behavioural Sciences, Macquarie University, Sydney, N.S.W. 2109, Australia
T. P. HUTCHINSON
Abstract. Half-lives of radioactive nuclides range over more than 20 orders of magnitude. It
is striking that, nevertheless, statistical laws may be discovered in these numbers: a log-normal
distribution provides a good description.
Keywords: Half-Life (Radioactivity), Log-Normal Distribution, Transformation of Data
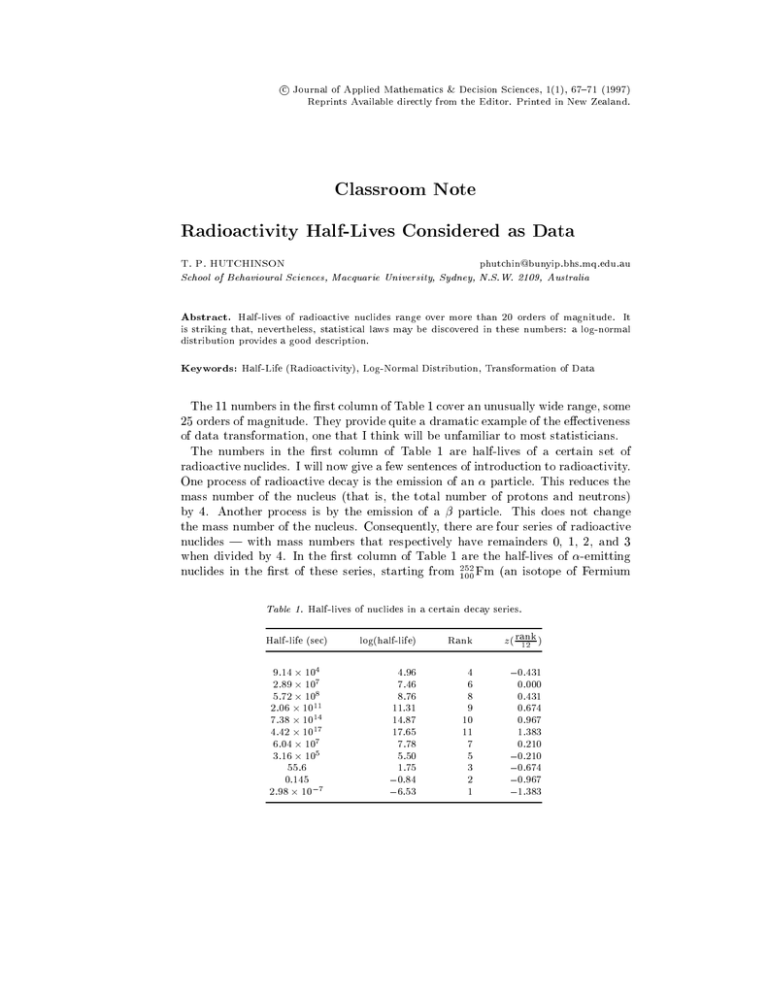
The 11 numbers in the rst column of Table 1 cover an unusually wide range, some
25 orders of magnitude. They provide quite a dramatic example of the eectiveness
of data transformation, one that I think will be unfamiliar to most statisticians.
The numbers in the rst column of Table 1 are half-lives of a certain set of
radioactive nuclides. I will now give a few sentences of introduction to radioactivity.
One process of radioactive decay is the emission of an particle. This reduces the
mass number of the nucleus (that is, the total number of protons and neutrons)
by 4. Another process is by the emission of a particle. This does not change
the mass number of the nucleus. Consequently, there are four series of radioactive
nuclides | with mass numbers that respectively have remainders 0, 1, 2, and 3
when divided by 4. In the rst column of Table 1 are the half-lives of -emitting
nuclides in the rst of these series, starting from 252
100 Fm (an isotope of Fermium
Table 1. Half-lives of nuclides in a certain decay series.
Half-life (sec)
log(half-life)
Rank
9 14 104
2 89 107
5 72 108
2 06 1011
7 38 1014
4 42 1017
6 04 107
3 16 105
55 6
0 145
2 98 10;7
4.96
7.46
8.76
11.31
14.87
17.65
7.78
5.50
1.75
;0 84
;6 53
4
6
8
9
10
11
7
5
3
2
1
:
:
:
:
:
:
:
:
:
:
:
:
:
z
( rank
12 )
;0 431
:
0.000
0.431
0.674
0.967
1.383
0.210
;0 210
;0 674
;0 967
;1 383
:
:
:
:
T. P. HUTCHINSON
68
Figure 1. Box-and-whisker plot of log(half-life). (The \box" extends from the lower quartile to
the upper quartile, and thus accounts for the middle 50% of observations, and the \whiskers"
extend out as far as the smallest and the largest observations. There being 11 observations, the
quartiles have been taken to be the 3rd and the 9th smallest.)
;10
;5
0
5
10
15
20
Figure 2. Cumulative distribution (plotted as the z -transformation) of log(half-life).
1:5
q
1:0
q
q
0:5
q
q
0:0
q
q
;0:5
q
q
;1:0
;1:5
;10
q
q
;5
0
5
10
15
20
RADIOACTIVITY HALF-LIVES CONSIDERED AS DATA
69
that has a half-life of about 1 day), and proceeding by way of 232
90 Th (an isotope of
Thorium that has a half-life of about 1010 years), to end with the stable 208
82 Pb (an
isotope of Lead). There are some -emitters in the series, which have been omitted
from this table. It should also be mentioned that one might question exactly what
nuclides should be included in this series. For example: (i) The series is usually
252
considered to start with 232
90 Th I have taken it back as far as 100 Fm, but not as far
256
as 102 No. (ii) Some nuclides decay by both -emission and -emission. However,
details like these are unimportant for present purposes.
It is dicult to get to grips with a set of numbers that vary so much from each
other, and it might seem a lost cause to try to discover any regularity or law
applicable to them. But we shall see that this is overly pessimistic. Column 2
of Table 1 shows the logarithms of the half-lives. If one did not know these were
logarithms to base 10, one would consider them and their box-and-whisker plot
(Figure 1) to be very ordinary-looking.
Can the log-half-lives be described by some well-known statistical distribution,
such as the normal? A standard way of proceeding is to plot z against log(half-life),
as this will be approximately linear in such a case here, z is dened via (z ) =
cumulative proportion of observations, where is the cumulative normal integral.
Column 3 of Table 1 shows the rank of the observations, from smallest to largest,
and column 4 shows the value of z that corresponds to rank/12. (It is common to
use i=(n +1), not i=n, as the \plotting position" of the ith smallest observation out
of a total of n.) Figure 2 shows that this plot is indeed approximately linear thus
we can conclude that the half-lives have approximately a log-normal distribution.
(The Weibull distribution, with the same general shape as the log-normal, is also a
good t.)
A common disadvantage of transforming data is that there is a loss of interpretability | in this case, time is a familiar variable, but it is by no means obvious
what the meaning of log(time) is. Happily, in this example there is an interpretation
of log(time), in terms of a theory of nuclear decay by -emission. This theory postulates the quantum-mechanical tunnelling of an -particle through the Coulomb
barrier formed by the attractive strong-interaction forces and the repulsive electrostatic forces. See, for example, 1] (pp. 115{119) or 2] (pp. 551{553). The energy
of the -particles emitted by a given nuclide is just as characteristic of the decay
process as the half-life is, and the theory referred to predicts a relation between
these two things this relationship will be close in the sense of there being a high
correlation, and strong in the sense that a small change in energy leads to a large
change in half-life. The relationship is one of linearity between log(half-life) and
energy;1=2 . (And some reasons are known why the relationship is not exact.)
So, instead of the distribution of half-life, let us look at the distribution of
energy;1=2 . Table 2 shows the values of this. The log-normal distribution of halflife that we had in Table 1, extending over 25 orders of magnitude, is reecting a
normal distribution of energy;1=2 that extends over a fraction of an order of magnitude, see Figure 3. (Incidentally, I make no claim that it is only the ; 12 power of
disintegration energy that is approximately normally distributed | this is true for
T. P. HUTCHINSON
70
Figure 3. Cumulative distribution (plotted as the z -transformation) of energy;1=2 .
1:5
q
1:0
q
q
0:5
q
q
0:0
q
q
;0:5
q
q
;1:0
;1:5
q
q
0:30
0:35
0:40
0:45
0:50
Figure 4. Scatterplot of log(half-life) vs. energy;1=2 .
20
q
q
10
q
q
q
q
q
q
0
q
q
q
;10
0:30
0:35
0:40
0:45
0:50
RADIOACTIVITY HALF-LIVES CONSIDERED AS DATA
71
Table 2. Disintegration energies of the nuclides in Table 1.
Disintegration
energy (MeV)
Energy;1=2
7.154
6.369
5.902
5.255
4.569
4.081
5.520
5.789
6.404
6.906
8.953
0.374
0.396
0.412
0.436
0.468
0.495
0.426
0.416
0.395
0.381
0.334
Rank
2
5
6
9
10
11
8
7
4
3
1
z
( rank
12 )
;0 967
;0 210
:
:
0.000
0.674
0.967
1.383
0.431
0.210
;0 431
;0 674
;1 383
:
:
:
several other powers, also.) For this set of nuclides, the scatterplot of energy;1=2
and log(half-life) is shown as Figure 4 the correlation is 0.94.
I need hardly say that there is much more that could be done with such data as this
| dierent sets of nuclides could be considered, and distributions other than the
log-normal could be used as the standard. However, I think there is a fundamental
limitation on this line of work, which is that it is usual to think of half-lives and
disintegration energies as constants, not as realisations of some random process. It
would therefore be misguided to ask why they should exhibit particular statistical
features (such as a log-normal or a Weibull distribution), or imagine a stochastic
mechanism by which they are generated. Presuming that this is right, it would be
meaningless to test, for example, whether the half-lives in the four disintegration
series (these were mentioned in the second paragraph of this paper) are from the
same distribution or not | there is no population and no procedure of random
sampling.
References
1. S. E. Hunt. Nuclear Physics for Engineers and Scientists. Ellis Horwood, Chichester, 1987.
2. W. Loveland. Radioactivity. In G. L. Trigg (Editor), Encyclopedia of Applied Physics.
Volume 15, pp. 547{563. VCH Publishers, New York, 1996.
