Supplementary Figure 1. Shih, Friedman, Drew, Tsai, Lyden and...
advertisement
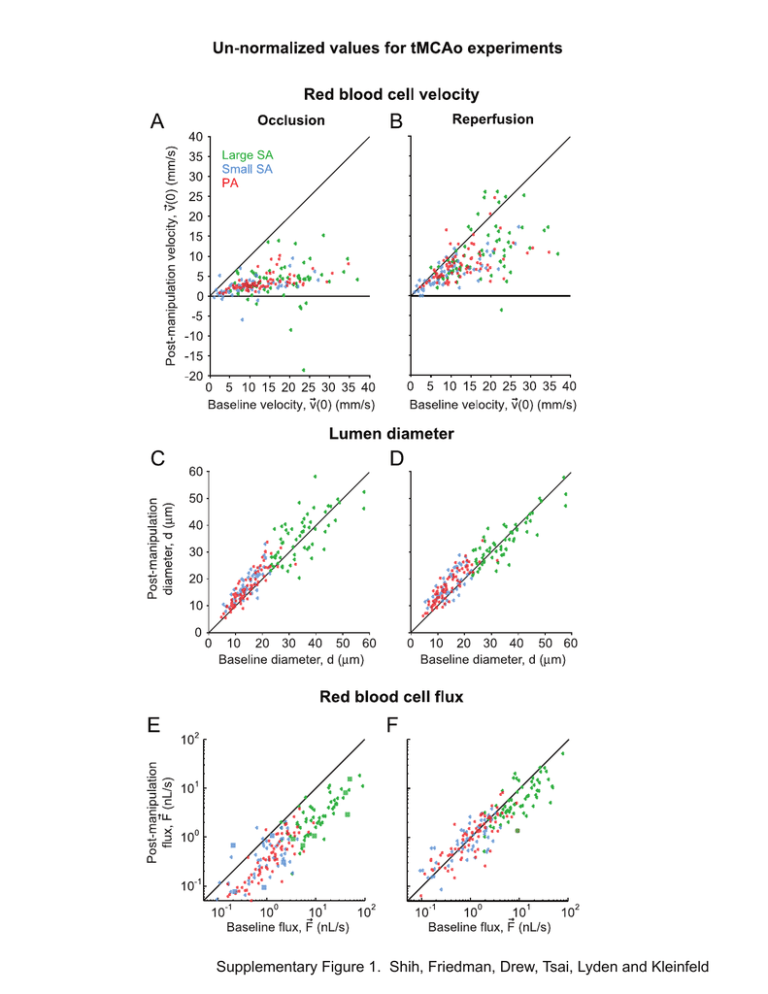
Supplementary Figure 1. Shih, Friedman, Drew, Tsai, Lyden and Kleinfeld Supplemental Table 1. Physiological parameters Baseline st (1 period) Occlusion nd (2 Reperfusion (3rd period) period) tMCAo: Koizumi Method (n = 11 animals) MABP* (mmHg) 81.9 ± 3.3 81.2 ± 2.6 81.8 ± 2.2 PaO2 (mmHg) 115.5 ± 7.4 119.2 ± 7.4 113.5 ± 5.4 PaCO2 (mmHg) 37.9 ± 2.4 41.9 ± 2.1 40.8 ± 1.9 7.37 ± 0.01 7.34 ± 0.01 7.35 ± 0.02 37.4 ± 0.2 37.2 ± 0.1 37.2 ± 0.2 MABP (mmHg) 84.7 ± 2.0 83.0 ± 1.5 83.2 ± 2.6 PaO2 (mmHg) 112.9 ± 1.8 102.5 ± 2.7 112.2 ± 3.0 PaCO2 (mmHg) 30.4 ± 1.0 33.9 ± 1.0 36.6 ± 1.1 pH 7.37 ± 0.01 7.34 ± 0.01 7.39 ± 0.01 Body Temperature (oC) 37.5 ± 0.1 37.5 ± 0.1 37.5 ± 0.1 MABP (mmHg) 85.5 ± 1.6 82.5 ± 0.8 83.5 ± 1.8 PaO2 (mmHg) 120.8 ± 1.2 121.0 ± 1.3 118.3 ± 0.9 PaCO2 (mmHg) 34.1 ± 1.0 37.9 ± 0.8 40.5 ± 0.5 7.34 ± 0.01 7.34 ± 0.01 7.34 ± 0.01 37.0 ± 0.1 37.1 ± 0.1 37.0 ± 0.1 MABP (mmHg) 94.8 ± 4.3 93.5 ± 7.9 — PaO2 (mmHg) 99.7 ± 3.8 94.3 ± 4.6 — PaCO2 (mmHg) 36.4 ± 2.6 35.2 ± 3.7 — 7.38 ± 0.01 7.31 ± 0.01 — 36.8 ± 0.2 36.8 ± 0.1 — 86.6 ± 4.3 87.4 ± 5.2 86.3 ± 6.2 pH o Body Temperature ( C) Sham tMCAo (n = 7 animals) Window Control (n = 6 animals) pH o Body Temperature ( C) Pimonidazole: Occlusioninjected (n = 6 animals) pH o Body Temperature ( C) Pimonidazole: Reperfusioninjected (n = 6 animals) MABP (mmHg) 1 PaO2 (mmHg) 98.1 ± 1.2 94.6 ± 3.9 99.6 ± 2.9 PaCO2 (mmHg) 39.5 ± 3.7 40.3 ± 3.2 44.2 ± 5.8 7.35 ± 0.02 7.31 ± 0.02 7.26 ± 0.03 37.2 ± 0.3 36.9 ± 0.1 37.0 ± 0.1 pH o Body Temperature ( C) tMCAo: Longa Method Baseline st (n = 4 animals) (1 period) Occlusion nd (2 period) Reperfusion rd (3 period) Hypercapnia (4th period) MABP (mmHg) 89.3 ± 2.2 94.3 ± 6.0 84.0 ± 0.6 85.8 ± 2.7 PaO2 (mmHg) 163.1 ± 9.7 131.4 ± 7.7 135.9 ± 8.1 396.3 ± 30.8 PaCO2 (mmHg) 39.6 ± 5.4 45.6 ± 1.1 40.1 ± 2.9 68.7 ± 7.9 7.27 ± 0.01 7.31 ± 0.02 7.29 ± 0.02 7.15 ± 0.03 36.8 ± 0.1 37.0 ± 0.1 37.0 ± 0.1 37.1 ± 0.1 pH o Body Temperature ( C) *MABP = mean arterial blood pressure. 2 Control experiments for in vivo imaging of tMCAo Sham tMCAo controls. To control the effects of CCA occlusion, we included a group with cranial windows, permanent CCA occlusion, and partial insertion of the occluding filament. RBC velocity in Sham tMCAo Controls was reduced, on average, to 60 % of the baseline levels for all classes of arterioles (29 large surface arterioles, 38 small surface arterioles, and 67 penetrating arterioles over 7 animals) (Supplemental Figs. 2A and 2B). This decrease in blood flow is consistent with unilateral CCA ligation in previous literature (Morita et al. 1997). Sham tMCAo Controls also exhibited an increase in arteriole diameter, albeit smaller in comparison to the tMCAo groups (≤ 10 % increase over baseline levels) (Supplemental Figs. 2C and 2D). RBC flux was initially reduced to ~ 60% of baseline and recovered slightly over the course of the experiment concurrent with vasodilation (Supplemental Figs. 2E and 2F). Cranial window controls. To control for the effect of generating a cranial window and of prolonged isoflurane anesthesia, a second control group had cranial windows but no major vessel occlusion. Over three periods of imaging, Window Controls exhibited relatively minor changes in RBC velocity, lumen diameter, and RBC flux in comparison with tMCAo and Sham tMCAo groups (42 large surface arterioles, 40 small surface arterioles, and 73 penetrating arterioles over 7 animals) (Supplemental Figs. 3A to 3F). These latter results confirm that generation of the cranial window alone could not account for the vasodynamic changes observed in other experimental groups. Further, this control verifies that prolonged isoflurane anesthesia could not account for large diameter changes seen during tMCAo. Hypercapnic dilation of large surface arterioles. In an additional control group with no major vessel occlusion, we found that hypercapnia, i.e., 57.6 mmHg blood CO2 versus 36.4 ± 2.2 mmHg for baseline, induced a significant 15.4 ± 0.3 % increase in the diameter of large surface vessels (p < 0.001, Wilcoxon test, n = 15 vessels from 4 animals); small diameter surface arterioles and penetrating arterioles were also significantly dilated in response to hypercapnia (data not shown). This finding is consistent with the global dilatory effect of inhaled CO2 (Kontos et al. 1977; Morii et al. 1986), and rules out the possibility that large pial arterioles were maximally dilated or unresponsive to stimulation. Supplemental Figure Legends Supplemental Figure 1. Un-normalized values of vasodynamic parameters measured during the ‘Koizumi’ method of tMCAo. (A and B) Centerline RBC velocity during occlusion and reperfusion plotted as a function of baseline velocity. Reversals in flow direction are reported as negative values. (C and D) Lumen diameter during occlusion and reperfusion plotted as a function of baseline diameter. (E and F) RBC volume flux during occlusion and reperfusion plotted as a function of baseline flux. Vessels that reversed flow direction from baseline conditions are shown as square markers. Supplemental Figure 2. Vasodynamic changes in Sham tMCAo controls. Change in (A and B) centerline RBC velocity, (C and D) lumen diameter, and (E and F) RBC volume flux plotted as a function of baseline lumen diameter. Second and third imaging periods were 90 min in length, as with occlusion and reperfusion periods of tMCAo experiments. A running average ± SEM (40 vessel window) is overlaid. Inset bar graphs show average change in flux ± SEM for each of the three vessel types. ** p < 0.01 and *** p < 0.001, significantly different from baseline (Wilcoxon test). Supplemental Figure 3. Vasodynamic changes in Window controls. Change in (A and B) Centerline RBC velocity, (C and D) lumen diameter, and (E and F) RBC flux plotted as a function of baseline lumen diameter. Second and third imaging periods were 90 min in length. A running average ± SEM (40 vessel window) is overlaid. Inset bar graphs show average change in flux ± SEM for each of the three vessel types. * p < 0.05 and *** p < 0.001, significantly different from baseline (Wilcoxon test). References Kontos HA, Wei EP, Raper AJ, Patterson Jr. JL. (1977) Local mechanism of CO2 action of cat pial arterioles. Stroke 8:226-229 Morii S, Ngai AC, Winn HR. (1986) Reactivity of rat pial arterioles and venules to adenosine and carbon dioxide: with detailed description of the closed cranial window technique in rats. J Cereb Blood Flow Metab 6:34-41 Morita Y, Fukuuchi Y, Koto A, Suzuki N, Isozumi K, Gotoh J, Shimizu T, Takao M, Aoyama M. (1997) Rapid changes in pial arterial diameter and cerebral blood flow caused by ipsilateral carotid artery occlusion in rats. Keio Journal of Medicine 46:120-127
