Ideal Gas Law Lab Report: Chemistry Experiment
advertisement
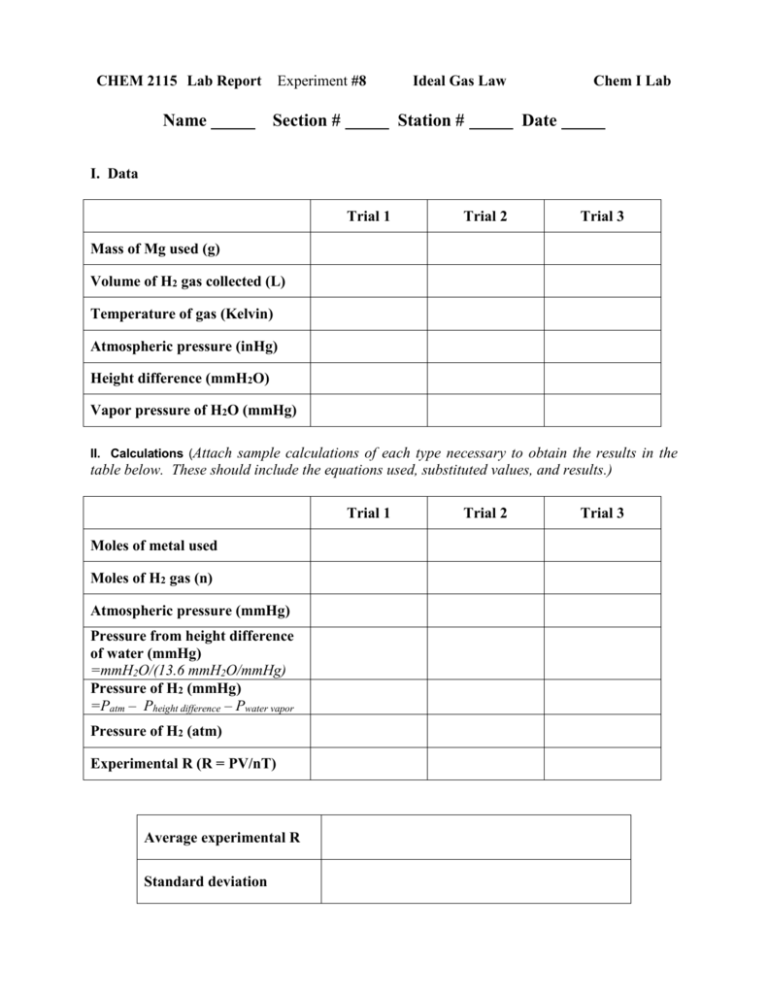
CHEM 2115 Lab Report Name Experiment #8 Section # Ideal Gas Law Station # Chem I Lab Date I. Data Trial 1 Trial 2 Trial 3 Mass of Mg used (g) Volume of H2 gas collected (L) Temperature of gas (Kelvin) Atmospheric pressure (inHg) Height difference (mmH2O) Vapor pressure of H2O (mmHg) II. Calculations (Attach sample calculations of each type necessary to obtain the results in the table below. These should include the equations used, substituted values, and results.) Trial 1 Moles of metal used Moles of H2 gas (n) Atmospheric pressure (mmHg) Pressure from height difference of water (mmHg) =mmH2O/(13.6 mmH2O/mmHg) Pressure of H2 (mmHg) =Patm – Pheight difference – Pwater vapor Pressure of H2 (atm) Experimental R (R = PV/nT) Average experimental R Standard deviation Trial 2 Trial 3 Indicate the correct number of significant figures for each of the following quantities: Pressure of H2 (atm) Volume of H2 (L) Moles of H2 (mol) Temperature of H2 (K) Experimental R III. Class Data Analysis. Download class data for this experiment from Blackboard, and calculate the value of R each data set. After you have calculated all of the R values, inspect the data. If any points are obviously far off from the others do not include them in the average. IIIA. If any of the data are to be excluded from the averages, note them here and explain why. Be sure to exclude them in any future class data calculations, for example the class average. III B. Calculate the average class value of R using the data on Blackboard. Then determine the standard deviation of the class data for the calculated values of R. Compare your value and the class value for R to the accepted value of R by computing the relative error. Report the results in the table below. Be careful to use the correct number of significant figures. Results for the Experimental Determination of the Ideal Gas Constant R Class average value of R Standard deviation of class data for calculated R Class relative error Your relative error III C. Comment on how close you came, and how close the class came, to the known value of R. Is your value closer or further from the known value than the class average? III D. Using the calculated standard deviation comment on spread of the class data. Is there a large degree of scatter or are the computed values of R fairly close to one another? IV. Some questions about experimental procedures. Would the following laboratory problems increase, decrease, or have no effect on the experimentally calculated value of R? Explain your answer. 1. When you weigh the magnesium, the weight on the balance was 0.054 g and you incorrectly recorded 0.045 g in your notebook? 2. You forgot to include the pressure due to the height difference between the beaker and the column of water? 3. You did not convert the height difference of water from mm H2O to mm Hg?
