Regional Data File Activities 5 Unit Russia and the Republics
advertisement
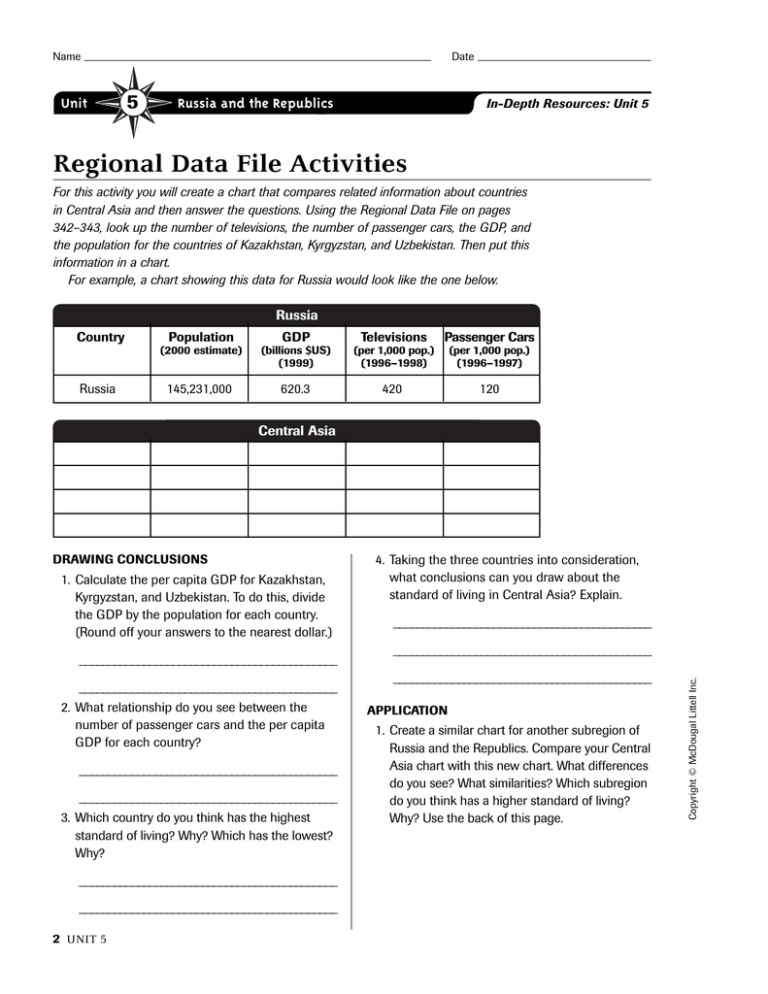
Date Name Unit 5 Russia and the Republics In-Depth Resources: Unit 5 Regional Data File Activities For this activity you will create a chart that compares related information about countries in Central Asia and then answer the questions. Using the Regional Data File on pages 342–343, look up the number of televisions, the number of passenger cars, the GDP, and the population for the countries of Kazakhstan, Kyrgyzstan, and Uzbekistan. Then put this information in a chart. For example, a chart showing this data for Russia would look like the one below. Russia Country Russia Population GDP Televisions Passenger Cars (2000 estimate) (billions $US) (1999) (per 1,000 pop.) (1996–1998) (per 1,000 pop.) (1996–1997) 145,231,000 620.3 420 120 Central Asia 1. Calculate the per capita GDP for Kazakhstan, Kyrgyzstan, and Uzbekistan. To do this, divide the GDP by the population for each country. (Round off your answers to the nearest dollar.) ____________________________________________ ____________________________________________ 2. What relationship do you see between the number of passenger cars and the per capita GDP for each country? ____________________________________________ ____________________________________________ 3. Which country do you think has the highest standard of living? Why? Which has the lowest? Why? ____________________________________________ ____________________________________________ 2 UNIT 5 4. Taking the three countries into consideration, what conclusions can you draw about the standard of living in Central Asia? Explain. ____________________________________________ ____________________________________________ ____________________________________________ APPLICATION 1. Create a similar chart for another subregion of Russia and the Republics. Compare your Central Asia chart with this new chart. What differences do you see? What similarities? Which subregion do you think has a higher standard of living? Why? Use the back of this page. Copyright © McDougal Littell Inc. DRAWING CONCLUSIONS
